Fig. 1.
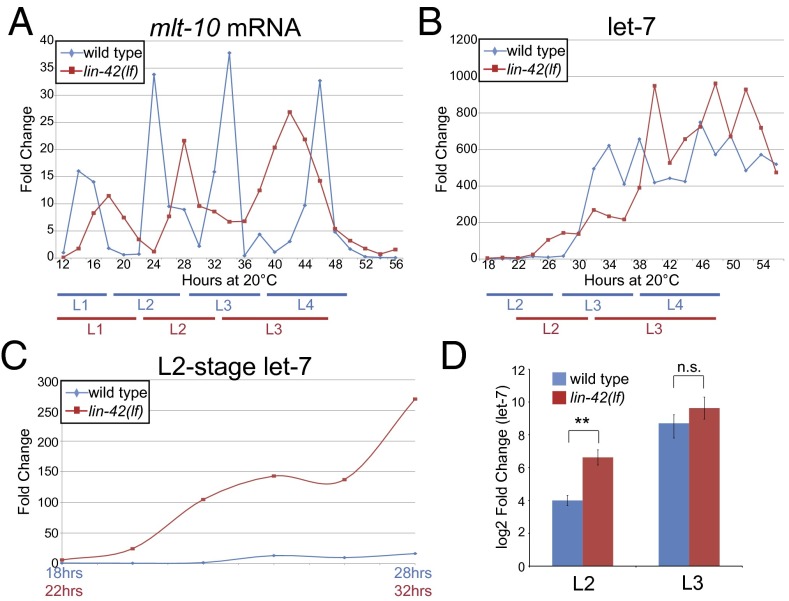
let-7 accumulates precociously in lin-42 mutants. (A) A representative biological replicate of mlt-10 mRNA levels in wild type and lin-42(lf) mutants from 12 to 56 h after starved L1s were placed on food. All time points were normalized to wild type at 12 h. Here and in subsequent figures, approximate stages based on mlt-10 expression are indicated with blue bars for wild-type and red bars for lin-42(lf). (B) let-7 levels in wild type and lin-42(lf) mutants in the 18- to 56-h samples analyzed in A, normalizing to wild type at 18 h. The let-7 assay was specific and the data are representative of three biological replicates (Figs. S1 and S2). (C) The L2-stage data from B graphed using the mlt-10 profiles to align developmentally similar time points. (D) Graph of let-7 levels at the time of mlt-10 peaks during the L2 and L3 stages averaged over three biological replicates. For example, the let-7 levels at 24 h in wild type and 28 h in lin-42(lf) were used from the biological replicate shown in A and B. For statistical purposes, log2(fold-change) values are shown. **P = 0.002, n.s., not significant, Welch’s t test. Error bars represent SD.

