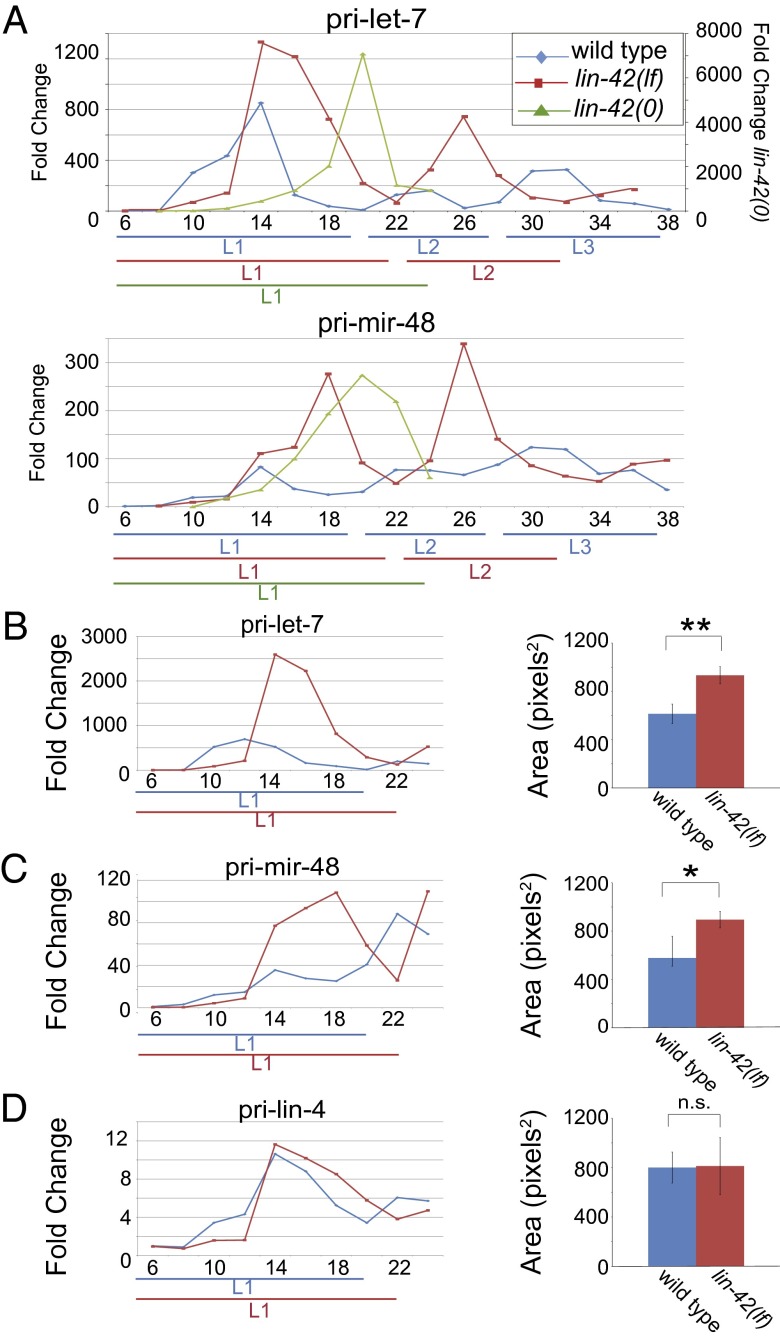
Fig. 3.
pri–let-7 and pri–mir-48 levels cycle and are increased in lin-42(lf) mutants. All samples are normalized to wild type at 6 h. (A) pri–let-7 (Top) and pri–mir-48 (Bottom) levels in wild type, lin-42(lf), and lin-42(0) populations. (B–D) pri-miRNA levels in L1-stage wild type and lin-42(lf) mutants (Left). pri-miRNA expression during the L1 stage from ≥3 biological replicates was calculated as the area under each curve in pixels-squared using ImageJ software (Right) (40). (B) pri–let-7. (C) pri–mir-48. (D) pri-lin-4. Data graphed in B and C are technical replicates of that shown in A, except that 2× total RNA was used in the assay. **P < 0.01, *P < 0.05, Welch’s t test.

