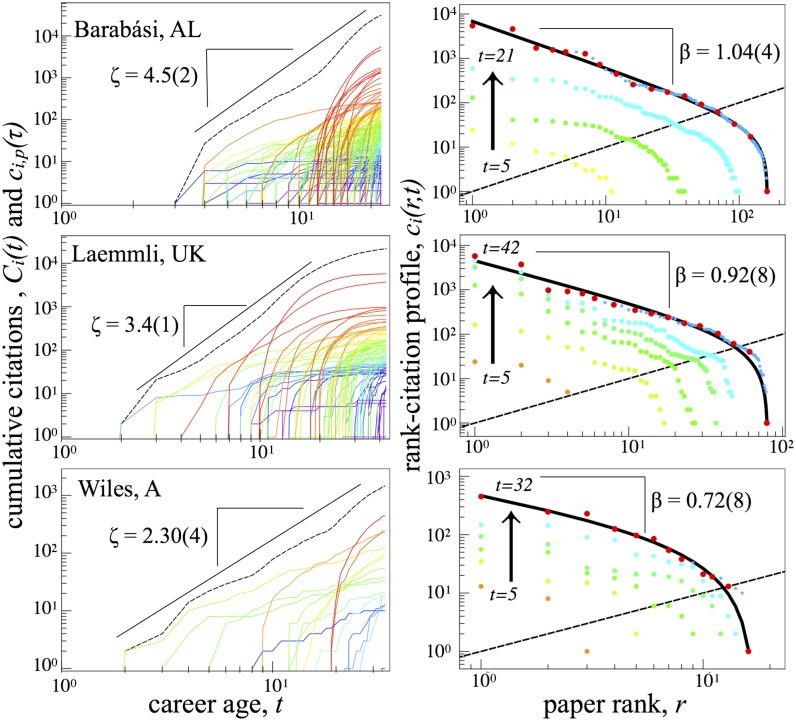
Fig. 2.
Quantitative patterns in the growth and size-distribution of the publication portfolio for scientists from 3 disciplines. (Left) for each author’s most cited papers (colored according to net citations in 2010) along with (dashed black curve). (Right) The evolution of each author’s rank-citation profile using snapshots taken at 5-y intervals. The darkest blue data points represent the most recent , and the subset of red data points indicate the logarithmically spaced data values used to fit the empirical data to our benchmark DGBD rank-citation distribution model (4) (solid black curve; SI Appendix). The intersection of with the dashed black line corresponds to the author’s h-index .

