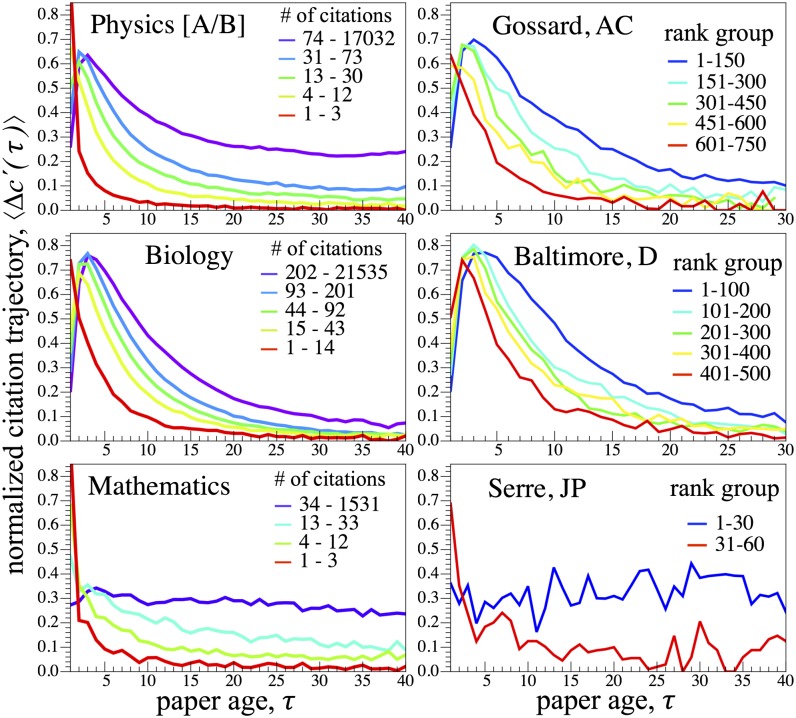
Fig. 3.
The citation life cycle reflects both the intrinsic pace of discovery and the obsolescence rate of new knowledge, two features that are discipline dependent. (Left) For each of three disciplines, the averaged citation trajectory is calculated for papers in the nth quintile with the corresponding citation range indicated in each legend. For example, for physicists in dataset [A], the top 20% of papers have between 74 and 17,032 citations, and the papers in percentile 21–40 have between 31 and 73 citations. (Right) calculated for rank-ordered groups of papers (listed in each legend) for three authors chosen from each discipline.

