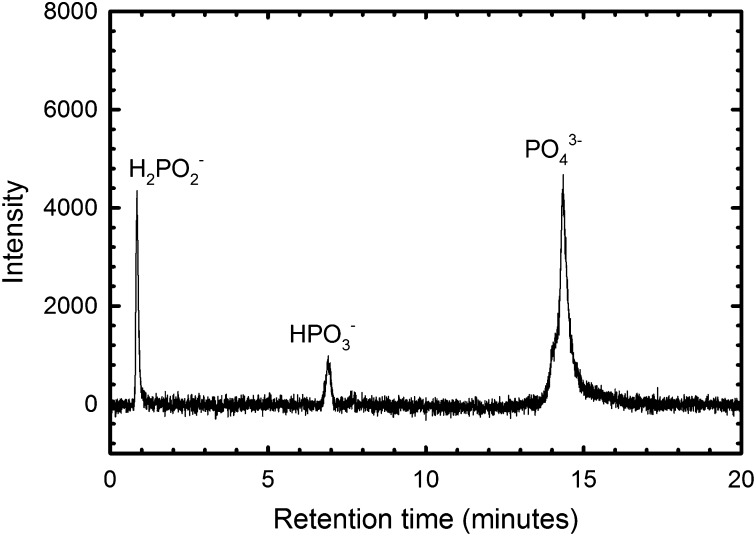
Fig. 2.
HPLC-ICP-MS spectrum of water from central Florida (River Front Park B-3-g, Tampa) showing hypophosphite (∼0.8 min), phosphite (∼7 min), and phosphate (∼14 min) peaks. The concentration of each P species was estimated from the peak height using standards with concentrations of 10−7 M, 5 × 10⁻⁷ M, 10−6 M, 5 × 10⁻⁶ M, and 10−5 M of each P species. Peak heights varied linearly with concentration (R2 = 0.999, 0.9996, and 0.998 for hypophosphite, phosphite, and phosphate, respectively), and the linear relationship between concentration and peak height was used to calculate individual P species concentration. Both reduced P compounds combined comprise about 26% of the total P (0.2 mg/L) in this sample.

