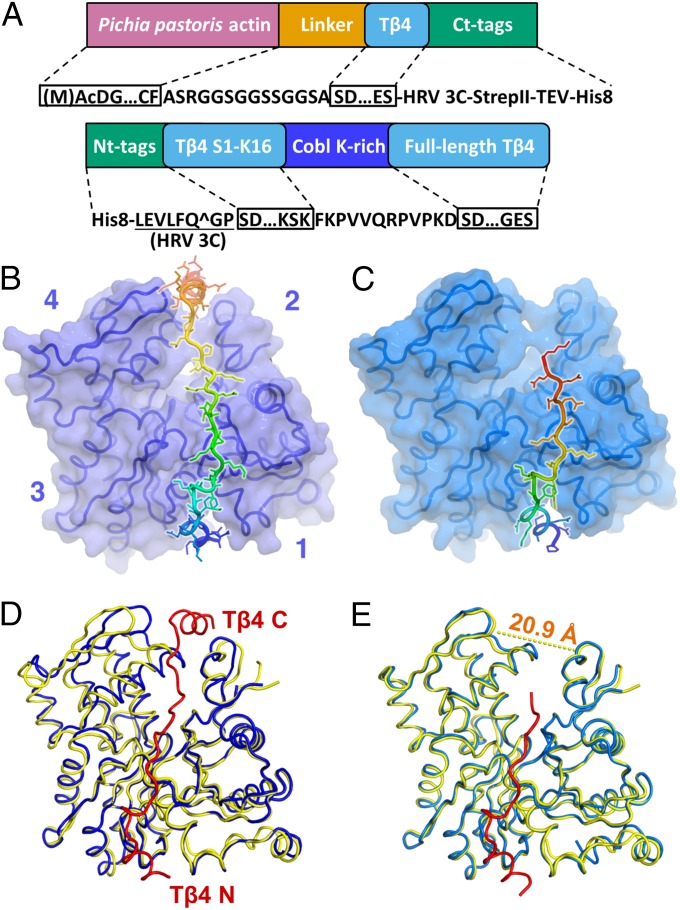
Fig. 1.
Two structures of Tβ4:actin. (A) Domain diagrams of (Upper) the hybrid constructs of P. (K.) pastoris actin–Tβ4 and (Lower) the peptide consisting of Tβ4 and the lysine-rich region of Cobl. (B) Structure of the Pichia actin–Tβ4 hybrid, with Tβ4 capping both the barbed and pointed faces of actin. In both B and C, actin is shown as a surface covering the Cα trace, and Tβ4 is shown as a rainbow-colored cartoon with sticks. Subdomains 1–4 of actin are indicated by numbers. (C) Structure of the Tβ4–Cobl peptide in complex with rabbit skeletal muscle actin. The C-terminal helix of Tβ4 visible in B is disordered in this structure. The visible portion of Tβ4 is referred to as Tβ4N. Actin is in cyan. (D) Significant conformational changes in actin induced by the fully bound Tβ4. The N and C termini of Tβ4 are indicated. The distance between the Cα atoms of Gly63 on subdomain 2 and Pro243 on subdomain 4 of actin reduces from 20.9 (dashed line in E) to 14.5 Å on Tβ4 binding. Actin is colored blue, and the fully bound Tβ4 peptide is in red. The native G-actin (PDB ID code 3HBT) is shown in yellow for comparison. (E) Minor conformational changes on actin induced by Tβ4N. The distance mentioned in D changes from 20.9 to 20.4 Å on Tβ4N binding. Actin is colored cyan, and the Tβ4N peptide is in red. The native G-actin is shown as in D.

