Fig. 1.
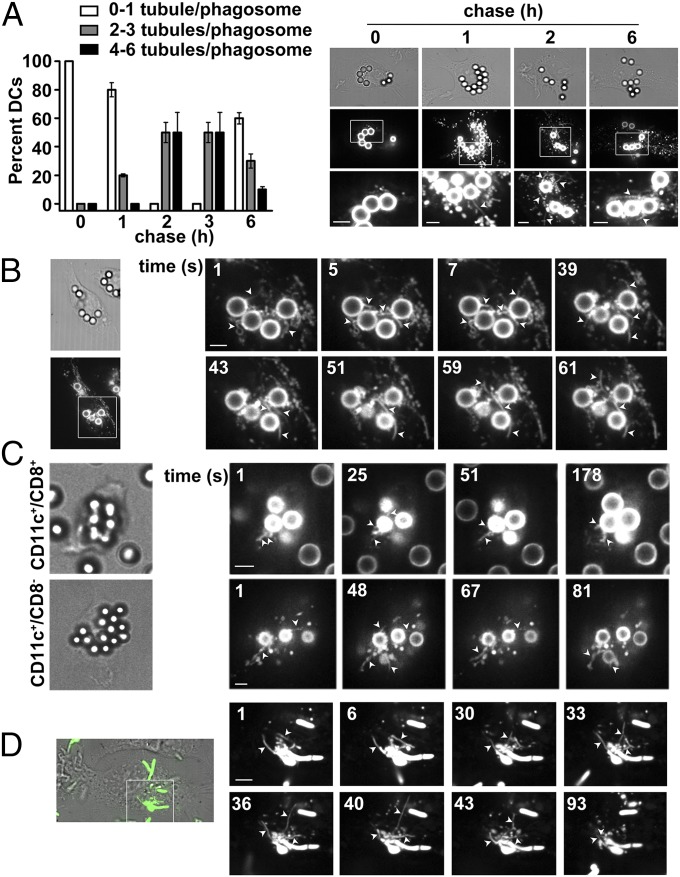
Tubules emerge from phagosomes in DCs. WT BMDCs (A, B, and D) or splenic CD8+ or CD8− DCs (C) were pulsed with LPS/OVA-TxR beads (A–C) or E. coli-EGFP (D) for 30 min, chased as indicated, and analyzed by live cell imaging. Arrowheads indicate phagotubules. (A) (Left) Tubules emerging from phagosomes over 2 min were quantified per phagosome at each chase time (10 cells per experiment, five independent experiments). The percentage of cells with the indicated average number of tubules/phagosome is shown. (Right) Representative frames from movies at indicated chase times. (Upper) Differential interference contrast (DIC) images emphasizing the beads. (Middle) TxR fluorescence. (Lower) Magnified insets from boxed region of the middle row. (B) Frame sequence of a representative movie after 2.5 h of chase. (C) Frames from representative movies showing DIC and TxR images after 2.5 h of chase. (D) Merged DIC and GFP fluorescence image from a single frame (Left) and frame sequence of representative movie of GFP fluorescence (Right) after a 2-h chase. (Scale bars: 2.6 μm.)

