Fig. 3.
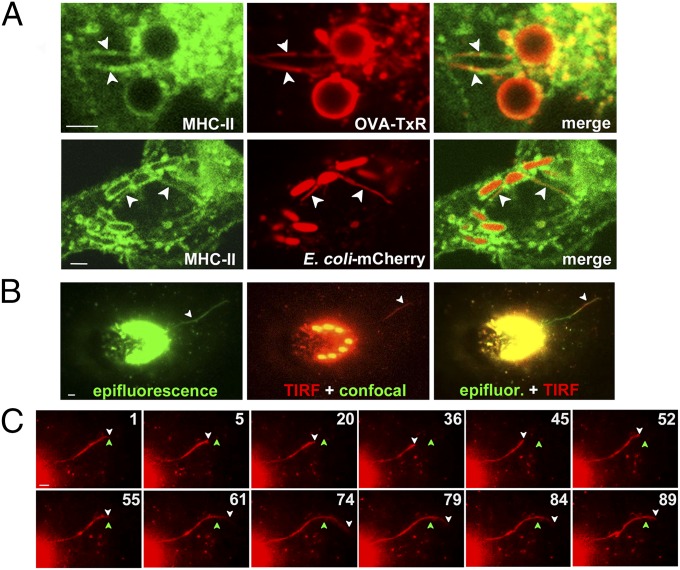
Phagotubules contain MHC-II molecules, but do not fuse with the plasma membrane. (A) WT MHC-II–GFP–expressing BMDCs were pulsed with LPS/OVA-TxR beads (Upper) or E. coli-expressing mCherry (Lower), chased for 2.5 h, and analyzed by live cell imaging. Shown is a magnified region from a frame of a representative movie (Upper) and a still image (Lower). Arrowheads indicate OVA-TxR or mCherry (red) on MHC-II–GFP–positive phagotubules (green). (B and C) WT BMDCs were pulsed with LPS/OVA-TxR beads, chased for 2.5 h, and analyzed by live cell imaging using epifluorescence and confocal and TIRF microscopy. (B) Shown are epifluorescence alone (green, Left), TIRF plane (red, Center) and confocal (green, Center; note the beads), and merged epifluorescence (green) and TIRF (red) images (Right) from a representative movie. (C) Frame sequence of the same movie in the TIRF plane, cropped to highlight the prominent phagotubule. The white arrowhead indicates the distal end of the extending phagotubule; the green arrowhead, a reference point for tubule extension and retraction over time. (Scale bars: 2.6 μm.)

