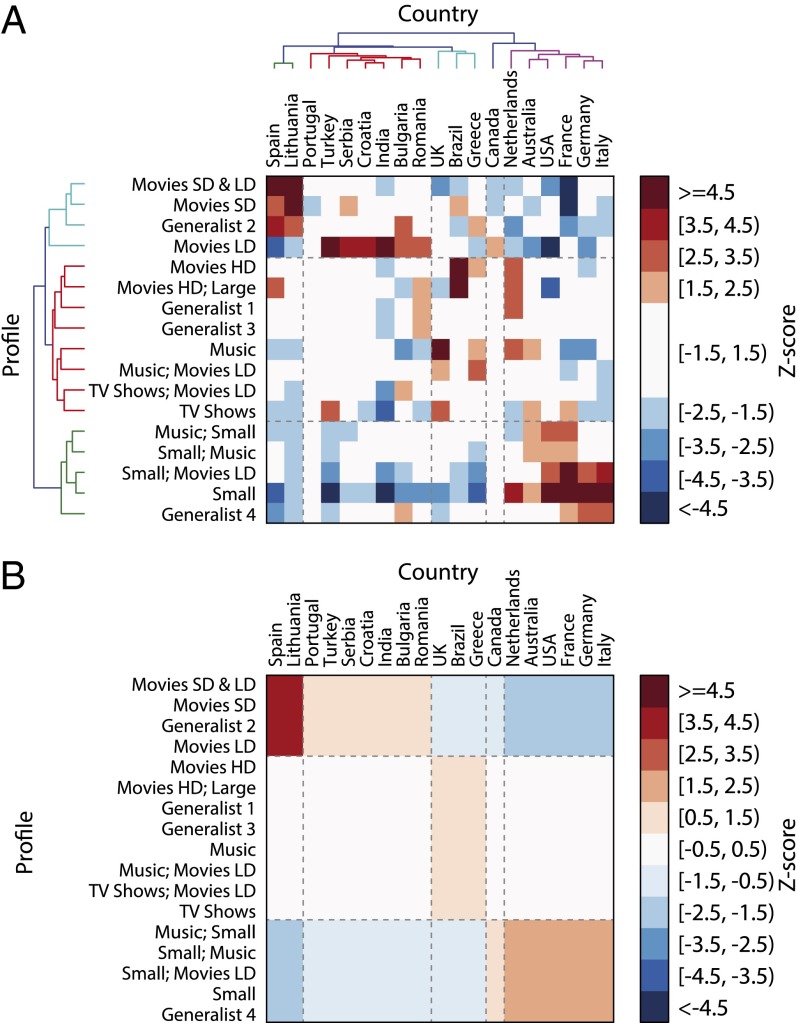
Fig. 3.
The distribution of user profiles by countries is heterogeneous. (A) Over- and underrepresentation of the 17 identified user profiles in each country. The graph shows the z-score of the number of users with a certain profile with respect to the null expectation of uniform distribution of user profiles among countries (only countries with more than 100 users are shown). Countries and user profiles are hierarchically clustered. (B) Average of the z-scores for the blocks defined in A. The blocks reveal that wealthier countries (e.g., the Netherlands, Australia, and United States) have an overrepresentation of small files and an underrepresentation of users that download movies and other large files; countries in the other blocks have the opposite tendency (SI Appendix).

