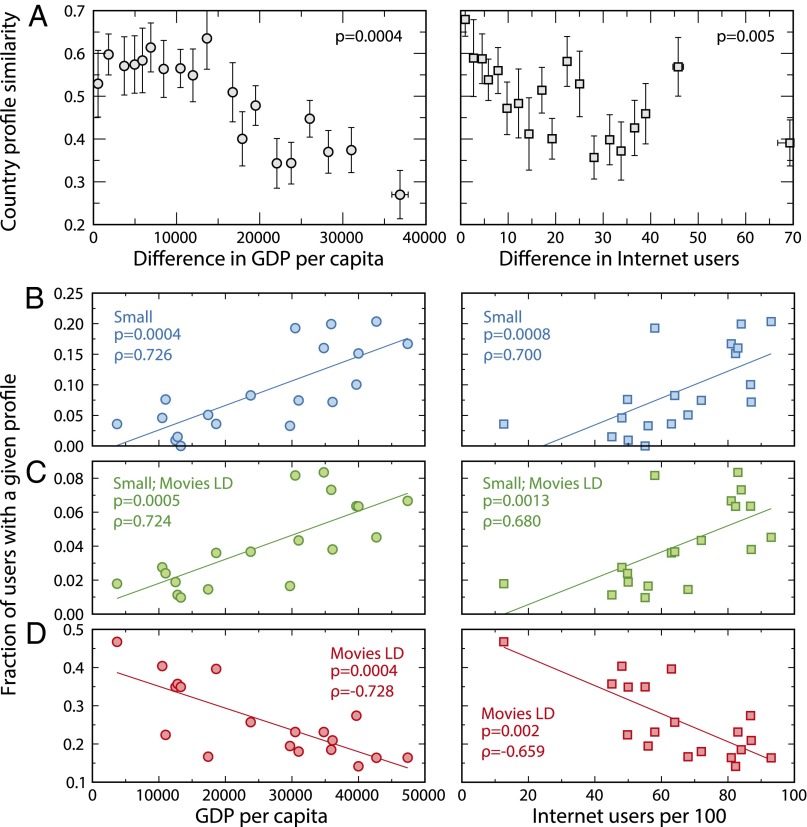
Fig. 4.
Correlation between users’ behavior and country socioeconomic indicators. We show here our results for two independent variables, GDP per capita in 2009 purchasing power parity US dollars (Left); Internet users (Right) per 100 people. (A) To investigate whether there is a correlation between user behavior and socioeconomic indicators of the country of residency, we analyze the similarity between pairs of country profiles (defined as the cosine similarity, scaled from 0 to 1, between the vectors of user profile z-scores; SI Appendix) as a function of their absolute difference in GDP per capita, and number of Internet users per 100 people. To establish the significance of these correlations, we calculate the Spearman ρ statistic for the observed pairs , where is the similarity between countries i and j, and is the absolute difference between countries i and j in socioeconomic indicator I. We bootstrap the values of the indicators for each country, and compute the P value comparing the observed ρ to the expected value from bootstrapped samples (SI Appendix). (B–D) Fraction of users in a country with a given profile [(B) profile Small; (C) profile Small; Movies LD; (D) profile Movies LD] as a function of the GDP per capita and number of Internet users per 100 people. We obtained the P values using Spearman’s rank correlation test (see SI Appendix and SI Appendix, Table S4 for a model selection analysis). The other user profiles (with the exception of profile Small; Music, which behaves similar to profile Small) do not show significant correlations (SI Appendix, Table S3).

