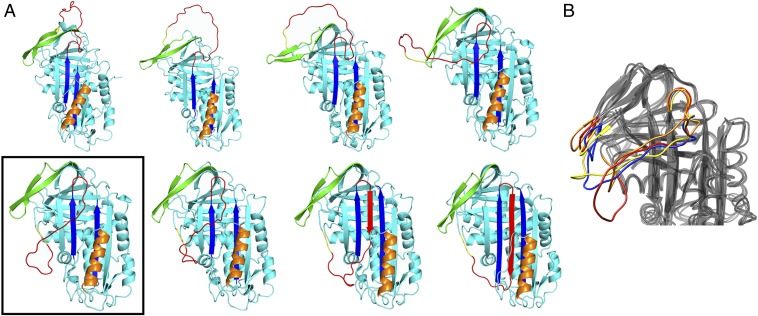
Fig. 2.
Conformations sampled along the PAI-1 active-to-latent pathway. (A) Snapshots along the DRP generated active → latent pathway. The boxed structure is the proposed prelatent state. (B) Superimposed frames from 200 ns of an unbiased MD simulation starting from the boxed structure in A. The RCL and gate regions are colored red (0 ns), orange (20 ns), yellow (100 ns), and blue (200 ns).

