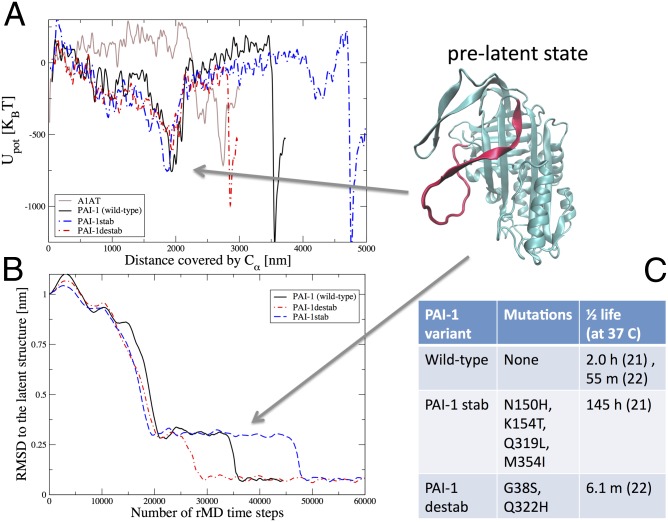
Fig. 3.
PAI-1 energy landscape shows pronounced minima for the prelatent and latent states. (A) Potential energy evaluated along the dominant pathways for PAI-1 WT (black curve), the PAI-1 variants (red and blue curves), and A1AT (brown curve) as a function of the total Euclidean distance covered by the Cα atoms during the latency transition. The structure in the upper right corner corresponds to the PAI-1 prelatent state. To resolve the energy landscapes better, the plotted potential energies were averaged over 15 consecutive frames in the DRP trajectories. The Euclidean distance is defined as where Ns is the number of frames in the dominant trajectory, NCα is the number of residues in the protein, and is the position of the kth Cα atom in the ith frame. Upot, potential energy. (B) rmsd to the latent state as a function of the number of rMD steps for all three PAI-1 variants. The prelatent state is revealed by a clear plateau in all three curves. (C) Mutations and active t1/2s for the PAI-1 variants.

