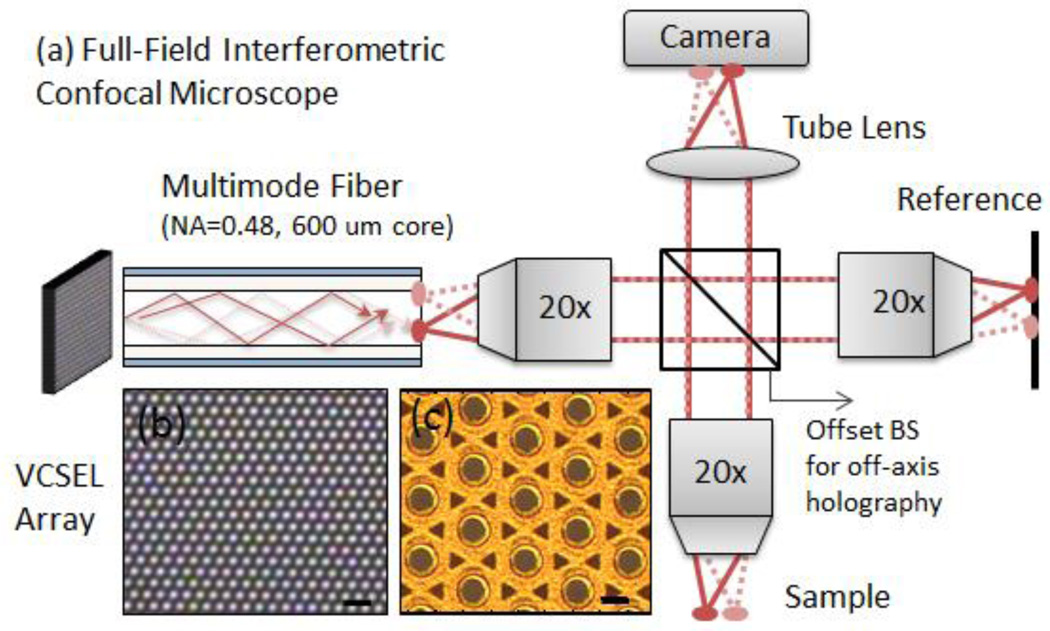
Fig. 1.
(a) Schematic of the full-field confocal microscope. (b) A top-view of the VCSEL array while lasing—each dot is a separate laser. The scale bar is 100 µm. (c) Magnified view of the VCSEL array—each circle is an independent laser. The scale bar is 20 µm. The VCSEL array was coupled to a 1 meter long multimode fiber which scrambled the modes providing a uniform illumination source. The emission leaving the multimode fiber was imaged using 20× (NA=0.4) objectives onto the sample and reference arm through a beamsplitter. The beamsplitter was offset from the optical axis of the sample arm in order to introduce interference fringes in the detected signal. A CCD camera was then used to record the interference pattern.

