Fig. 2.
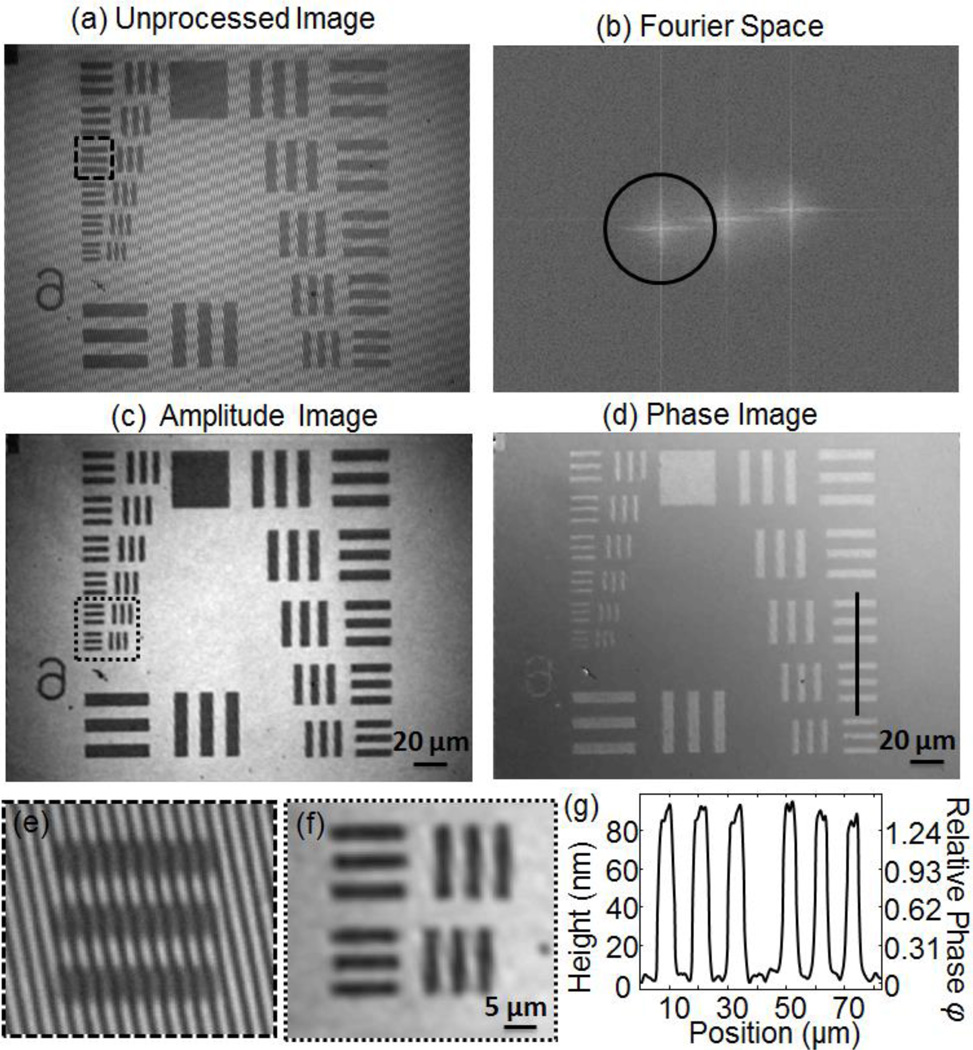
(a) The unprocessed interference pattern measured on the CCD camera shown in Fig. 1. High contrast fringes are visible across the image. (b) The spatial Fourier transform of the image in (a). A Hann window indicated by the black circle was used to select the off-axis component. This component was then shifted back to the center of Fourier space. The amplitude (c) and phase (d) of the field from the sample is recovered after inverse Fourier transform of the filtered image in (b). (e) Magnified view of the region indicated in (a) showing high contrast interference fringes. (f) Magnified view of the region indicated in (c); features separated by 2.19 µm are clearly distinguishable. (g) The step height of the Air Force chart features extracted from the phase image along the cross section line shown in (d).

