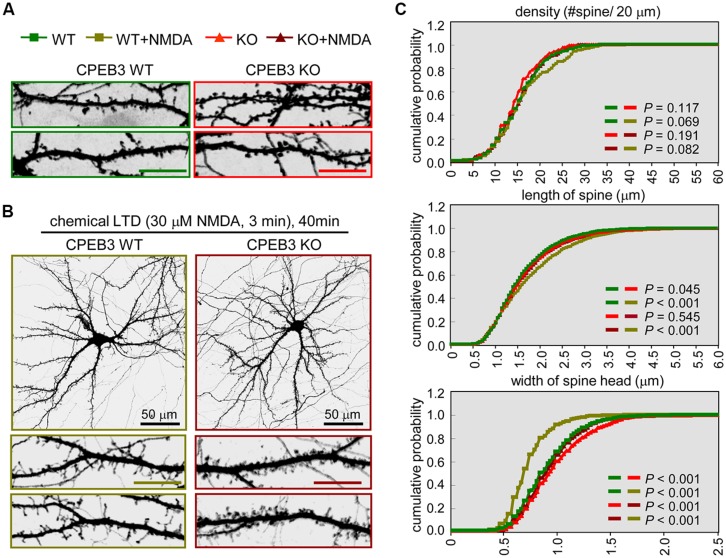
FIGURE 1.
The CPEB3 KO neurons with enlarged spine heads displayed retarded morphological changes under c-LTD. The WT and KO neurons were transfected with the EGFP plasmid on DIV14 and treated on DIV18 (A) without or (B) with 30 μM NMDA for 3 min and then incubated for 40 min prior to fixation for GFP immunostaining. The images and quantified spine data in (C) were labeled with different colors, WT: green, WT + NMDA: moss green, KO: red, KO + NMDA: maroon. Representative images of whole neurons and dendritic spine areas are shown. The scales are 10 μm unless otherwise denoted. (C) Quantification of the dendritic spine morphologies. Approximately 20 pyramidal neurons in each group were collected from three independent cultures and analyzed using the MetaMorph software. The cumulative probability curves for density, length and width of dendritic spines in each group (∼2,000 spines) were plotted and analyzed for significant differences between groups using Student’s t-tests.

