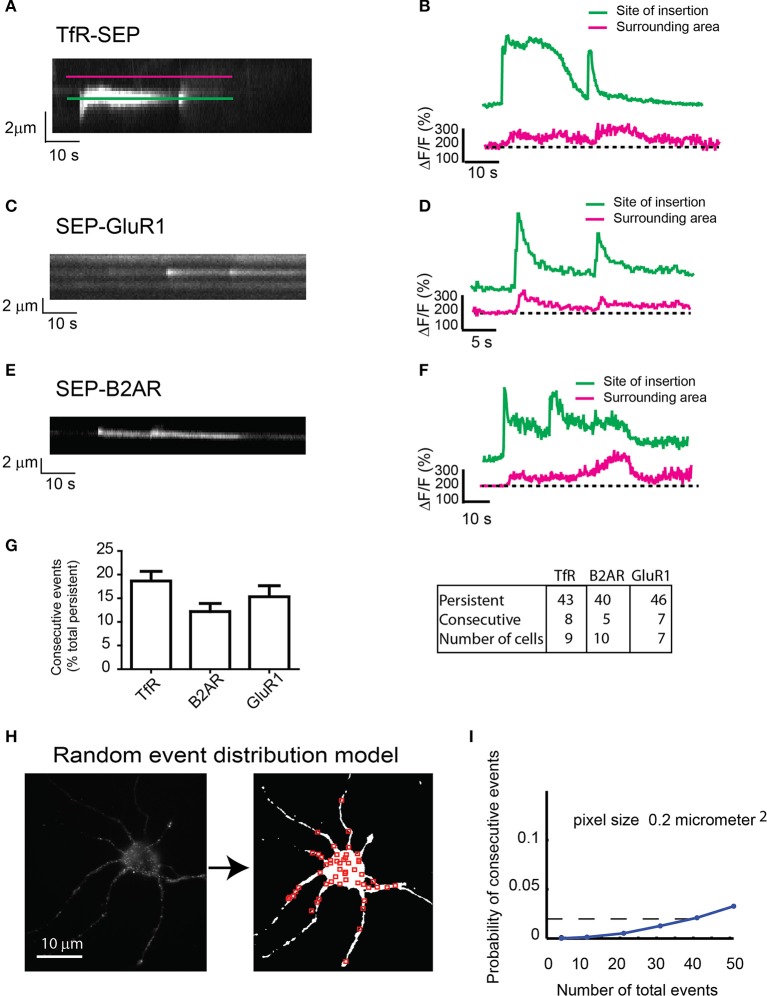
Figure 3.
Consecutive exocytosis of transmembrane receptors. (A) Kymograph from hippocampal neurons transfected with TfR-SEP showing consecutive exocytotic events. (B) Maximum intensity measurements from (A). Green or Blue line indicates intensity changes at the site of insertion; red line indicates lateral receptor spreading from the site of insertion along the plasma membrane. (C) Kymograph of SEP-GluR1 consecutive events in hippocampal neurons. (D) Intensity measurements from (C). (E) Kymograph of SEP-B2AR consecutive events in hippocampal neurons. (F) Intensity measurements from (E). (G) Number of persistent and consecutive events for all the receptors. (H) Conversion of a neuron to a threshold image in which red squares are randomly placed events (n = 51). (I) Probability of having one colocalized event as a function of total events based on the random distribution from (H). The calculated probability of observing consecutive events is ~0.02.

