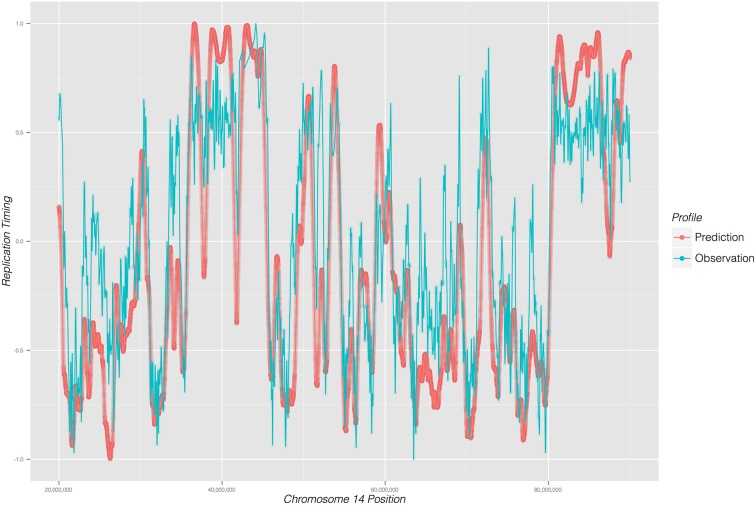
Figure 2.
DNA replication timing profile for a 65 mega-base region on chromosome 14 of mouse embryonic cells. Replication time (early to late; y-axis) is plotted as a function of genome position (x-axis). Predicted profile (red) was generated from DNase I DGF data; experimentally observed timing profile is depicted in blue.

