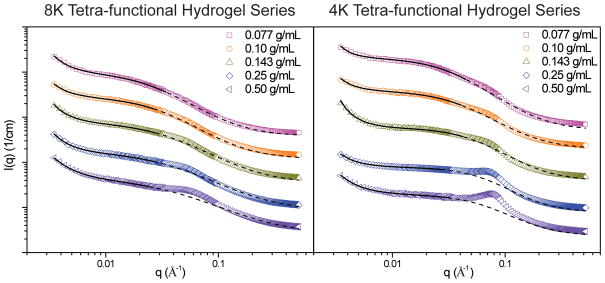
Figure 7.
8K and 4K tetra-functional PEG hydrogels at varying initial polymer concentrations. Symbols indicate scattering data, while solid lines indicate the fit of the correlation length model the data. The dashed lines indicate the portion of the model that was not fit to the data. Spectra have been shifted for clarity.

