Figure 3.
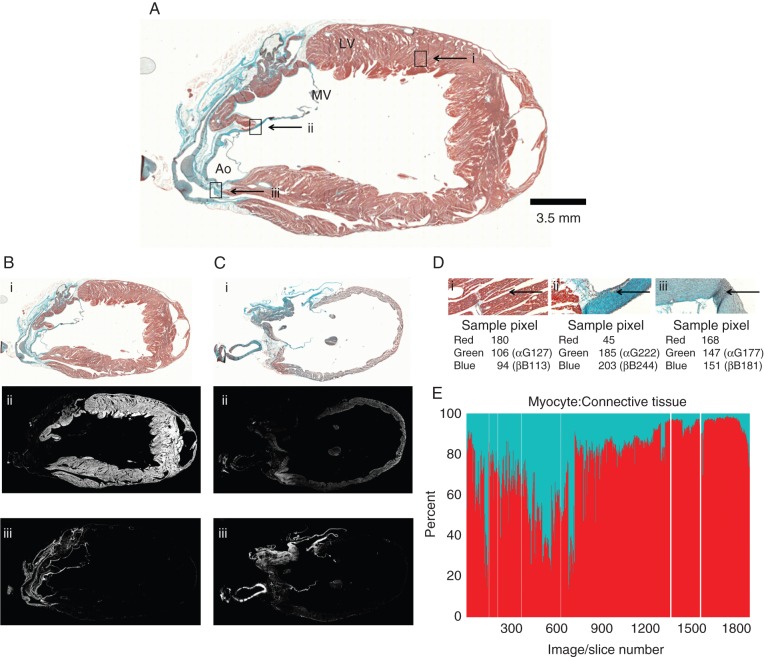
Histology-based cell-type segmentation. (A) Trichrome-stained rabbit heart section #925, containing. Ao, aorta; LV, left ventricle; MV, mitral valve; scale bar 3.5 mm. Rectangles i, ii, and iii correspond to locations of tissue type segmentation in panel (D). (B, C) Two sample histology images that are shown as trichrome-stained sections (B-i and C-i); after myocyte segmentation (B-ii, C-ii), and after connective tissue segmentation (B-iii, C-iii). (D) Enlarged aspects of the trichrome-stained section in panel (A). Image area dominated by myocytes (D-i), connective tissue (D-ii), or cells that are ‘undefined’ by the algorithm (D-iii). Arrows point to location of sample pixels analysed. (E) Summary data showing the ratio of myocyte: connective tissue pixels in the entire stack of slices, ordered in the same sequence as in Figure 2G and H (red: myocyte pixels, blue: connective tissue pixels). White lines: missing sections in the histology stack.

