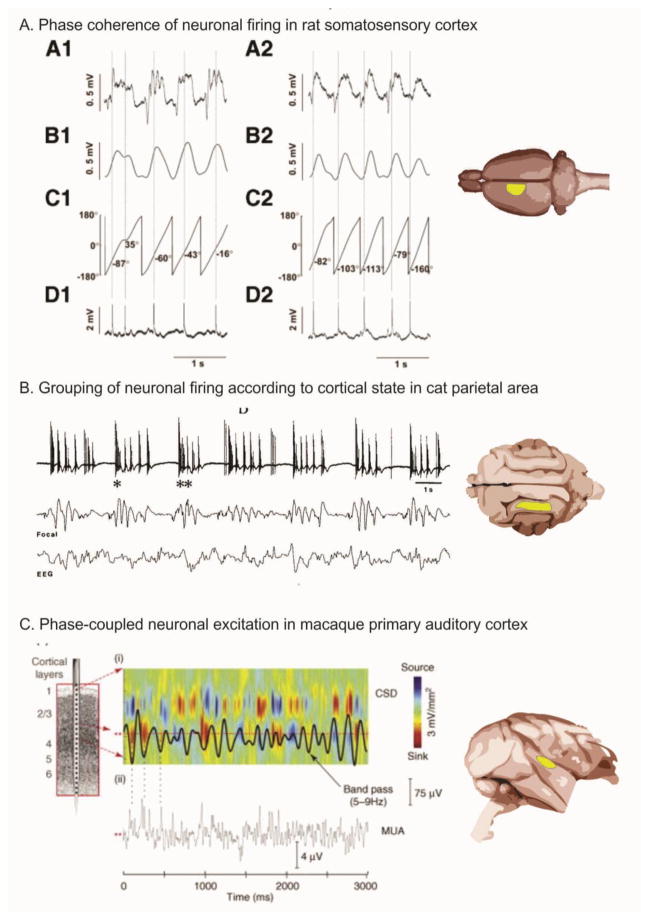
Figure 2. Oscillations control neuronal excitability.
Panel A. On the left, four aspects of neural activity are shown: the low pass filtered local field potential (LFP) (A1), the amplitude activity (B1), phase activity (C1) and multiunit activity (MUA) (D1) (Slezia et al., 2011). A2-D2 shows the same indices for an oscillation that increases in frequency. Panel B. MUA bursting of cat parietal corticothalamic neurons (top trace) occurs in the Delta frequency range and co-occurs with slower (0.3–0.4 Hz) LFP rhythms (middle trace) and scalp recorded electroencephalographic (EEG) activity (bottom trace) (Steriade et al., 1993). Panel C. In macaque (Lakatos et al., 2005), a current source density (CSD) profile for the supragranular layers of auditory cortex (i) sampled using a multielectrode (left) shows Theta-band (5–9 Hz) oscillatory activity (superimposed black line). Drop lines from ii shows coincidence of simultaneously recorded MUA activity. Reproduced, with permission, from [33] (A), [38] (B), [77] (C).

