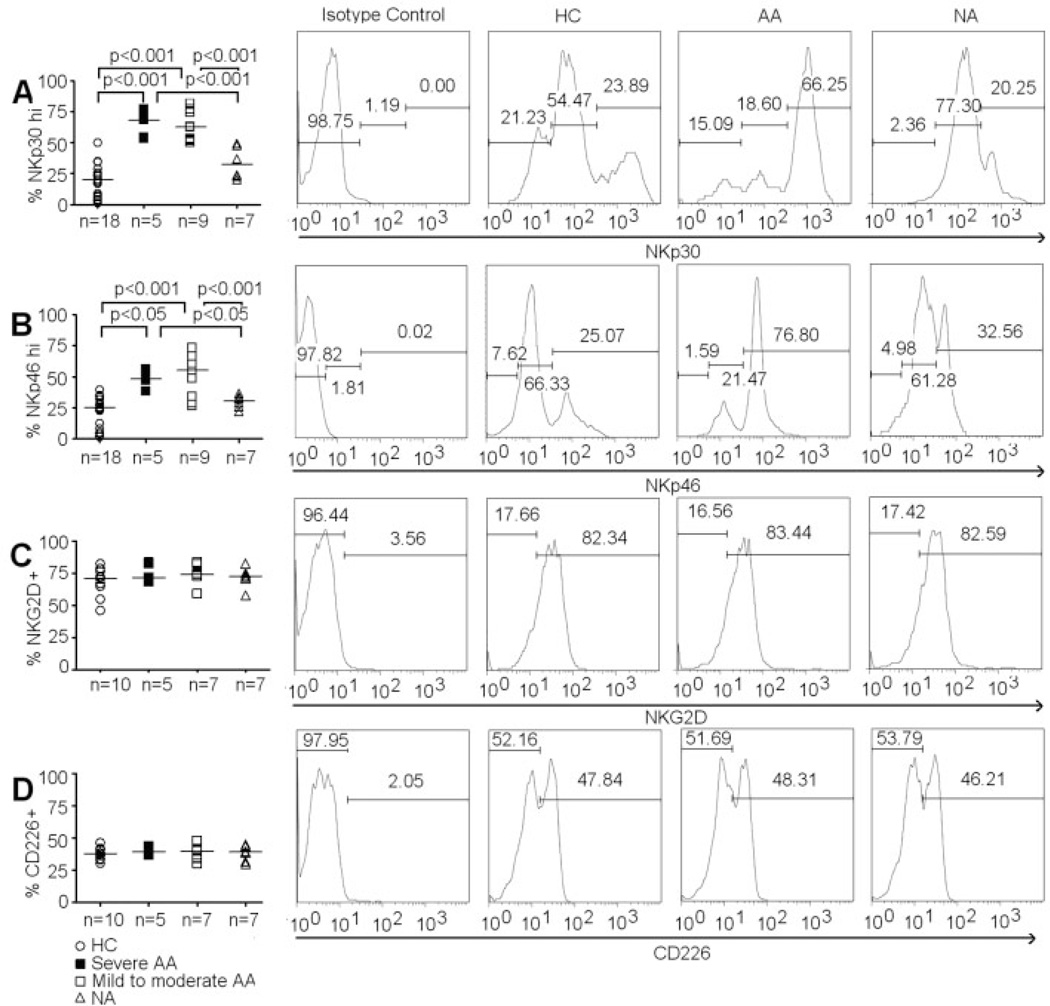
Figure 2.
Expression of activating receptors on CD4+ iNKT cells. (A) Percentage of CD4+ iNKT cells that are NKp30hi. (B) Percentage of CD4+ iNKT that are NKp46hi. (C) Percentage of CD4+ iNKT cells that express NKG2D. (D) Percentage of CD4+ iNKT cells that express CD226. Histograms of NKp30, NKp46, NKG2D, and CD226 expressions on CD4+ iNKT cells in representative HC, AA and NA samples. ANOVA was used for statistical analysis. p values represent results from post-ANOVA comparison. Horizontal bars represent median values.

