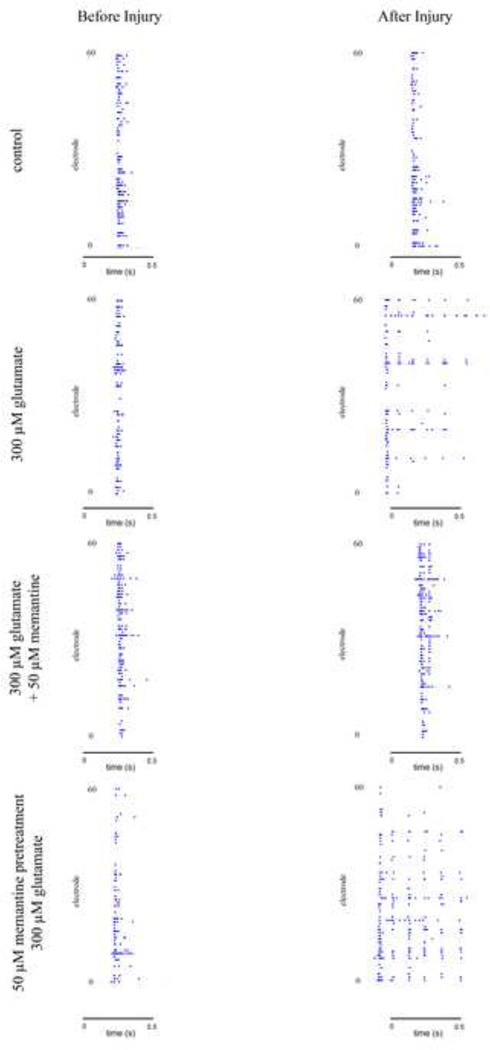
Figure 6. The effect of glutamate and memantine treatment on burst duration.
Example SBEs before and after drug treatment for control cultures, cultures treated with 300 µM glutamate, cultures treated with 50 µM memantine at the same time as 300 µM glutamate, and cultures pretreated with 50 µM memantine followed by 300 µM memantine treatment. Each picture encompasses a single SBE. Each dot in the graphs represents a recorded spike.

