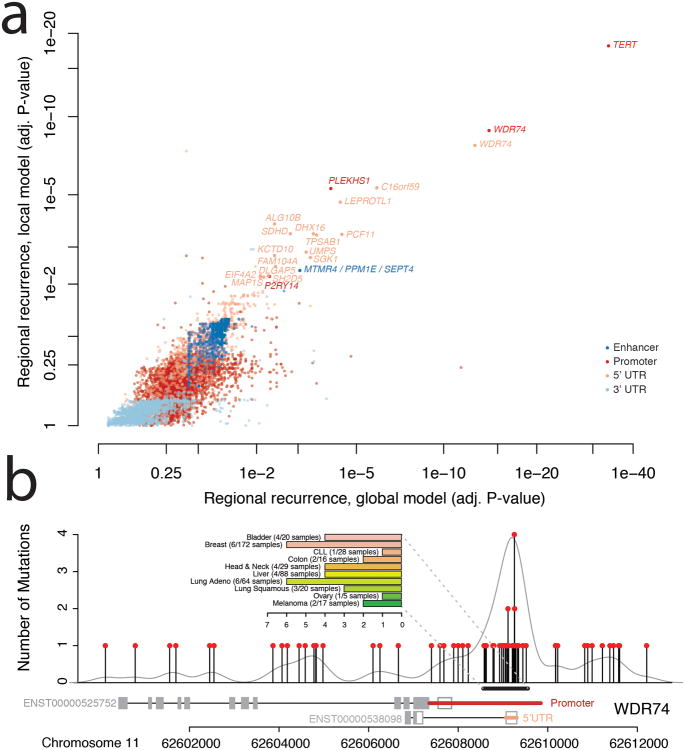
Figure 3. Regional Recurrence Analysis.
a) Significance of recurrent mutations in regulatory regions of interest. Regulatory regions for individual genes are shown according to local (y-axis) and global (x-axis) measures of statistical significance (false discovery rate adjusted p-value). Colors represent types of regulatory region. b) Strong enrichment of mutations in the promoter region of WDR74 in contrast to the remainder of the gene sequence. The bar chart summarizes the frequency of the hotspot mutation in individual cancer types (colors correspond to Figure 1a).

