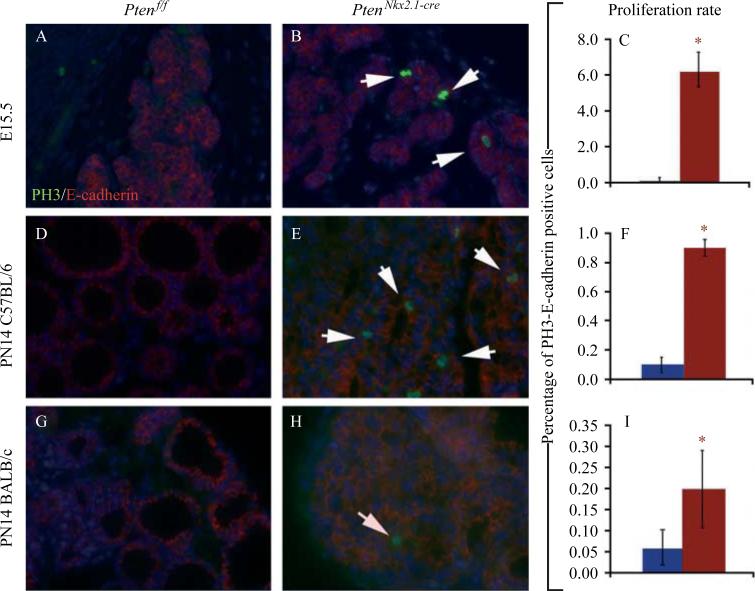
Figure 4.
Double IF staining for PH3 (marker for proliferation) and E-cadherin (marker for epithelial cells) as well as quantification of the number of E-cadherin and phosphohistone H3 double-positive cells in control and mutant thyroids at (A–C) E15.5 and (D–F, C57BL/6 background; G–I, BALB/c background) PN14 (n=3 for each group). Note that in the BALB/c background, the increase in epithelial proliferation is not as pronounced compared with the one observed in the C57BL/6 background. Note that for proliferation at E15.5, no differences were observed between both genetic backgrounds. White arrows in B, E and H indicate double positive cells for E-cadherin and phosphohistone H3. p<0.05.

