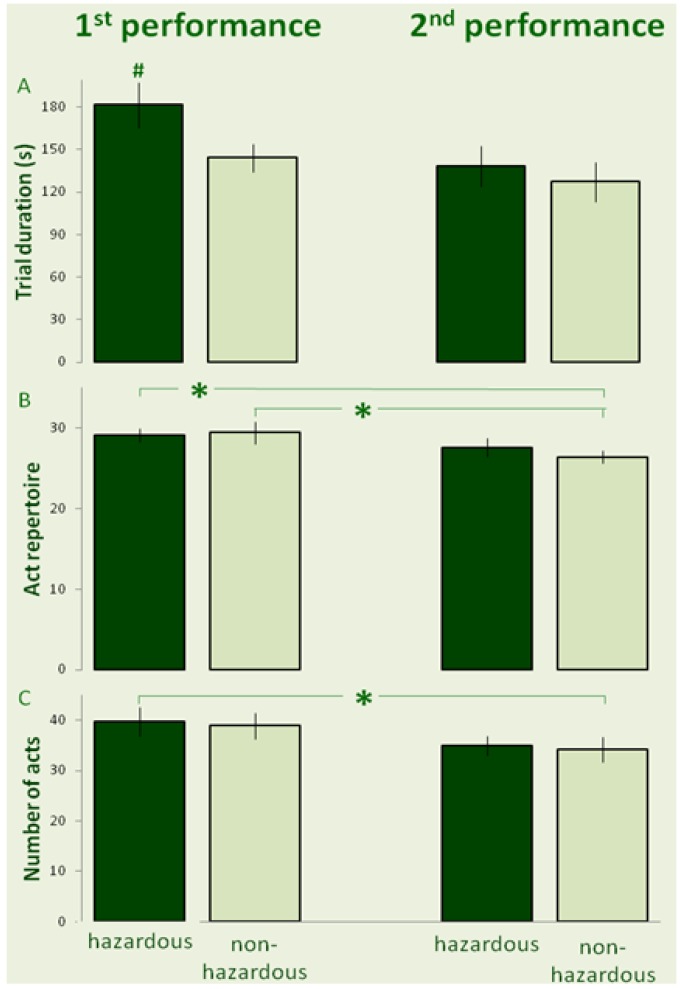
Figure 1.
The mean (± SE) of trial duration (A), act repertoire (B), and the total number of acts (C) are depicted for hazardous (dark bars) and non-hazardous trials (light bars) during the first performance (left-hand insets) and second performance (right-hand insets). # indicates a significant difference compared to all other trials. (* indicates a difference between the trials, connected by the horizontal line.)

