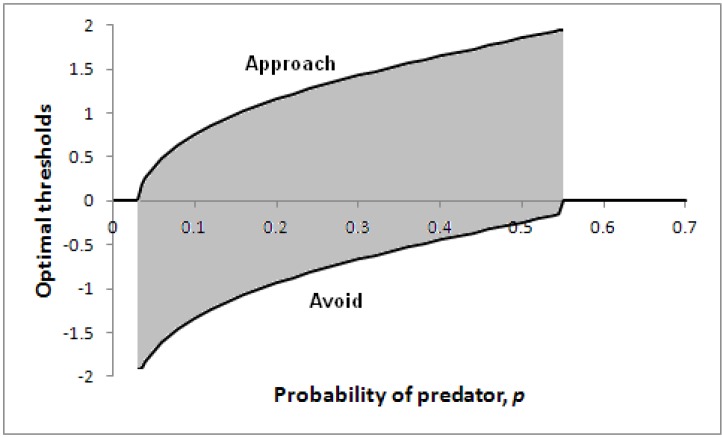
Figure 5.
Optimal thresholds for approach (upper line) and avoidance (lower line) as a function of p in a particular scenario.
Parameters: V = 5, c = 1, θ = 0.2, λ = 0.2. A decision only needs to be made for 0.03 < p < 0.55 (the shaded region); with less risk it is better to approach immediately before the likely prey has time to escape; with greater risk, it is better to avoid immediately.

