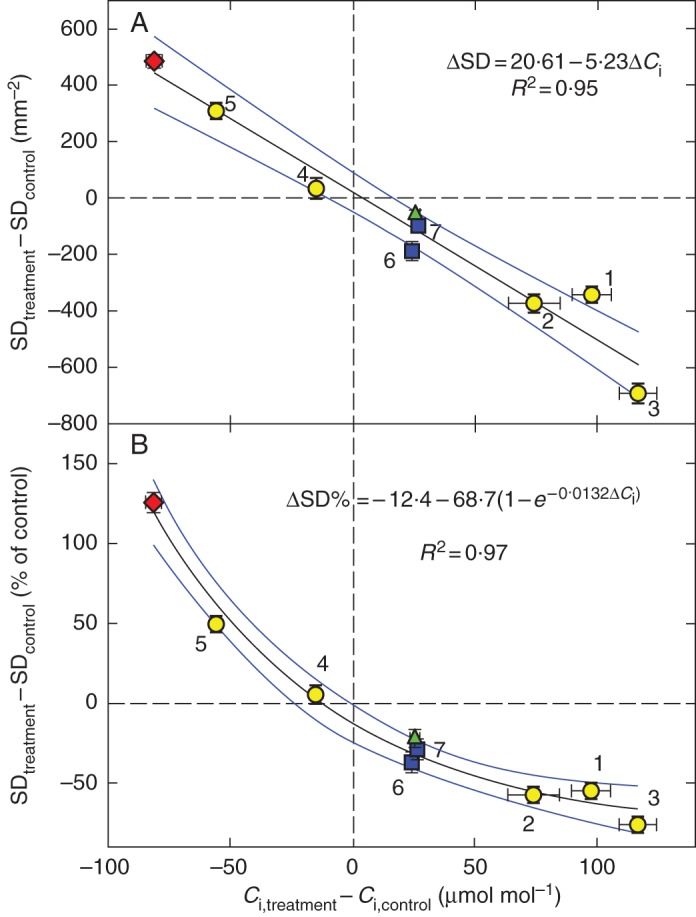
Fig. 1.

Effects of shading and water stress treatments on internal CO2 concentration of the leaf, Ci, as inferred from the δ13C in leaf biomass, and on stomatal density SD. (A) Circles indicate increased (1, 2, 3) and decreased (4, 5) Ci, and concomitant changes in SD, under low light in sunflower grown in nutrient solution (1), with ABA (2) or PEG (3) added, and under high light in sunflower fed with ABA (4) or PEG (5). Values are differences between treatments and control, i.e. plants grown under high light in plain nutrient solution; nci = nSD = 6–8. The triangle shows the effect of shading on beech leaves (single tree, sampled during the 2007 and 2009 seasons, nci = 18, nSD = 20). Squares depict the shading effect in Arabidopsis thaliana rosette leaves grown for 18 d at irradiances of 200 or 80 μmol m–2 s–1, respectively (ecotypes Columbia and C24, nci = 6, nSD = 18). Diamonds indicate the ABA effect in cress plants (nci = 5, nSD = 48). All plants experienced an atmospheric CO2 concentration close to 390 μmol mol–1. (B) The changes in SD from (A) expressed as a percentage of control. The points sharing the same Ci co-ordinate in (A) and (B) represent identical treatments. Standard errors of the mean (bars), regression lines and 95 % confidence intervals are shown.
