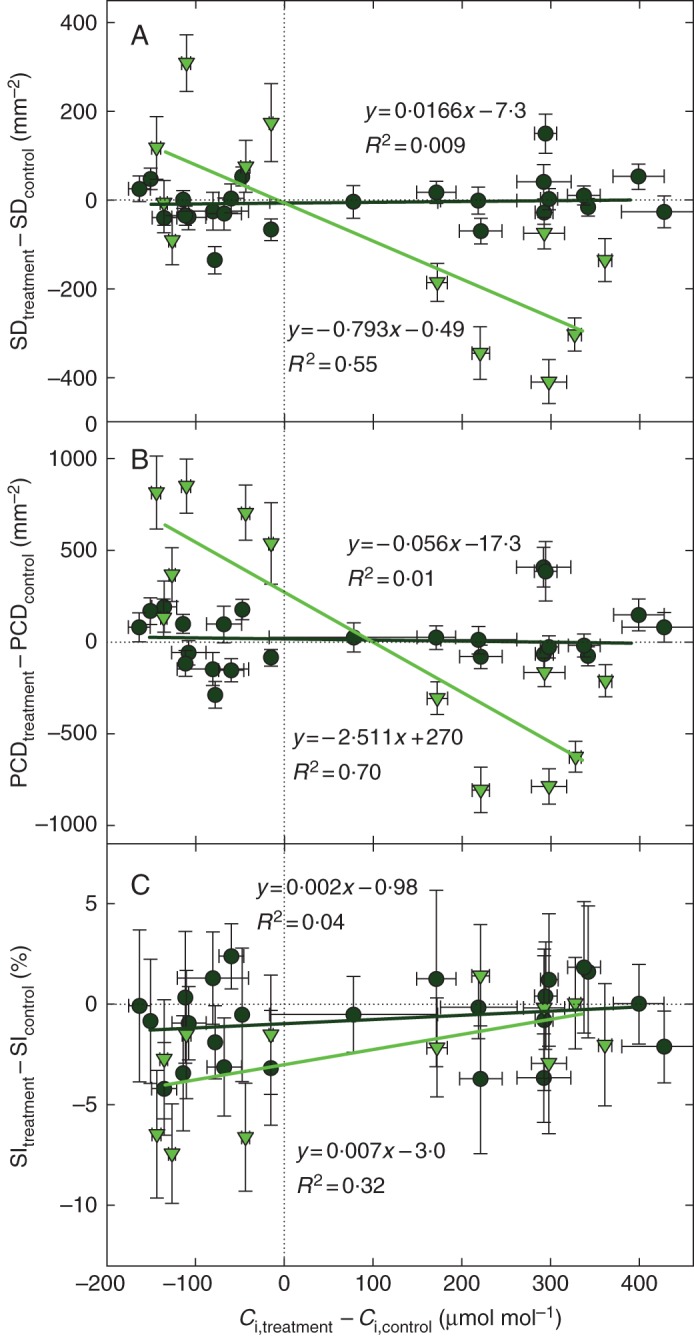
Fig. 2.

Changes in internal CO2 concentration (Ci) of the leaf in Lepidium sativum plants grown under sub-ambient or super-ambient CO2 concentrations, as related to changes in stomatal density (SD; A), pavement cell density (PCD; B) and stomatal index (SI; C). The negative values of the Ci difference show by how much Ci was lowered when Ca was reduced from 400 to 180 μmol mol–1; the positive values indicate the increase of Ci in plants grown at 800 compared with controls kept at 400 μmol mol–1. Stomatal and pavement cell density in the first leaves (light green triangles and light green regression line) was much more sensitive to CO2 concentration than in cotyledons (dark green circles and dark green regression line). Each point represents a difference between the Ca treatment (180 or 800) and Ca control (400) for one of three sub-treatments (two air humidities and hypobaric plants), each grown either in air or in helox gas mixture. Data for 14-day-old leaves and 7- and 14-day-old cotyledons are shown. The SD and Ci values used in calculation of the differences were means from three independent measurements (three plants per treatment). The Ci values were calculated from δ13C in plant dry matter (see Appendix). Bars show the standard error of the mean, for SI calculated from the primary SD and PCD data [see eqn (6) in ‘Statistical evaluation, meta-analysis’].
