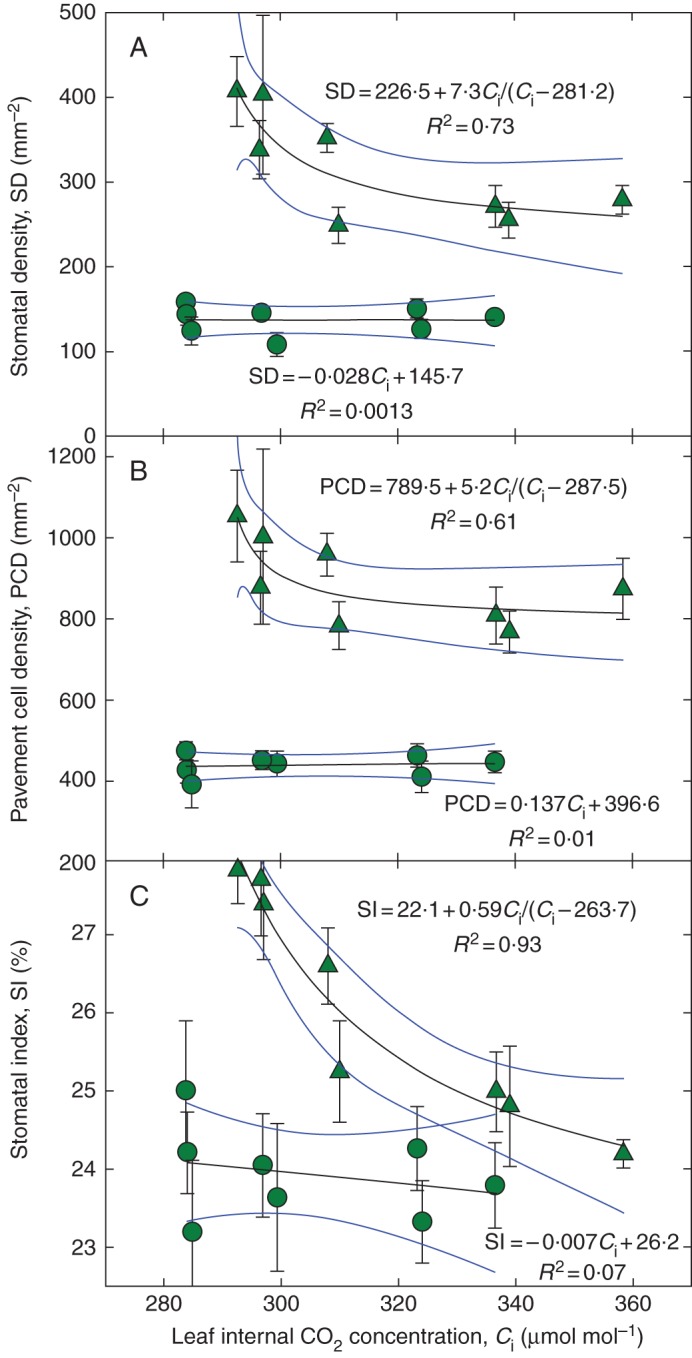
Fig. 4.

Response of stomatal density (SD; A), pavement cell density (PCD; B) and stomatal index (SI; C) of Lepidium sativum leaves and cotyledons to the internal CO2 (Ci) of leaves grown at various irradiances. The light green triangles and light green regression lines represent the first leaves; the dark green circles and dark green regression lines show the cotyledons' response. The plants were grown for 21 d under 7–8 photosynthetic photon flux densities (PPFDs), ranging from 100 to 590 μmol m–2 s–1, in 100 mL glass cuvettes ventilated with ambient air. The points represent averages from six independent runs of the experiment. Mean values and the standard error of the mean are indicated. Linear or hyperbolic fits with 95 % confidence intervals are shown.
