
Figure 4. Upstream transcription interferes with the activation of 5’ but not 3’LTR in J-Lat 9.2 and 15.4 cells.
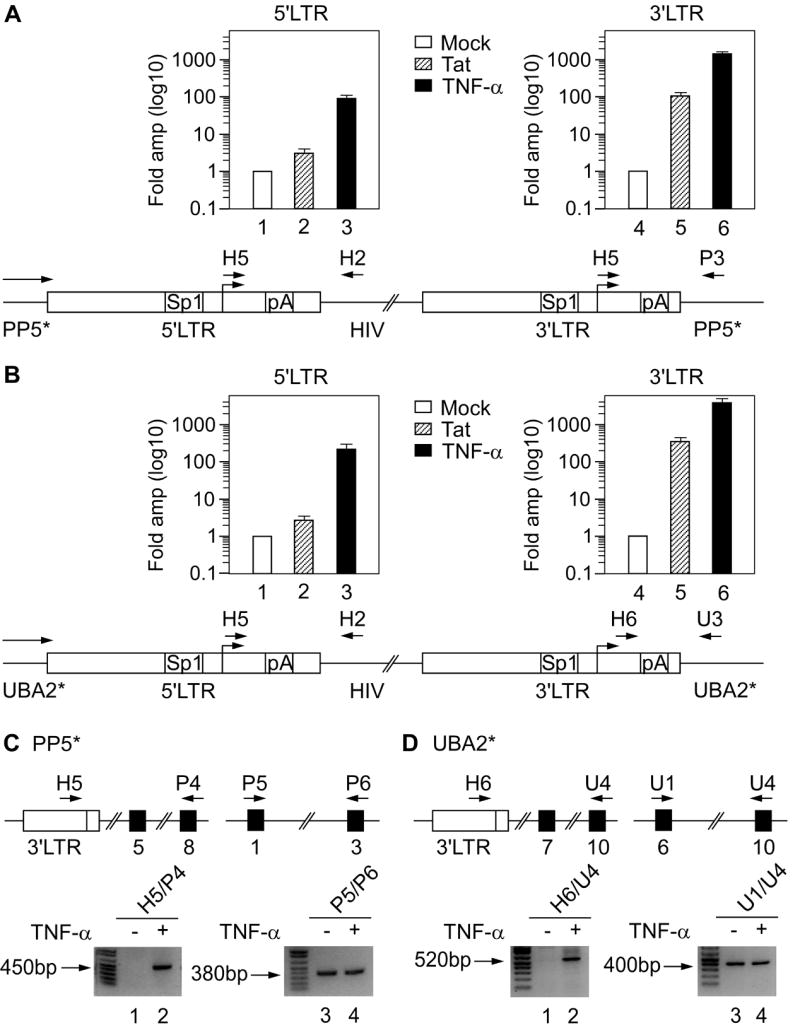
(A and B) Top: cells were electroporated with Tat (hatched bars) or induced with TNF-α (black bars) and activation of transcription from the 5’ (left diagram) and the 3’LTR (right diagram) was determined using RT-qPCR. Levels represent fold amplification of cDNA from treated (Tat or TNF-α) cells over cDNA from untreated (mock, white bars). Values in different samples were normalized to the GAPDH signal. The results for four RT-qPCR assays are shown ± SEM. Schematic representations of the HIV genome in J-Lat 9.2 and 15.4 cells are presented below the RT-qPCR data. On both LTRs, binding sites for Sp1 and pA sites are marked. Horizontal arrow above the gene designates ongoing transcription from the PP5* and UBA2* promoters. Primers used for amplification of transcripts from the 5’ and 3’LTRs are marked above the scheme. (C and D) RT-PCR was used to determine activation of transcription from the 3’LTR. Schematic representations of a part of the PP5* and UBA2* alleles with numbered exons (black rectangles) and the 3’LTR (white rectangle) are presented on top. Primers used for amplification of fragments from cDNA are marked above the scheme. Bottom panels show agarose gels with fragments obtained by RT-PCR from untreated (-) or TNF-α treated (+) J-Lat 9.2 and 15.4 cells. The primer pairs used are written above the lanes. The right panels represent a normalizing control.