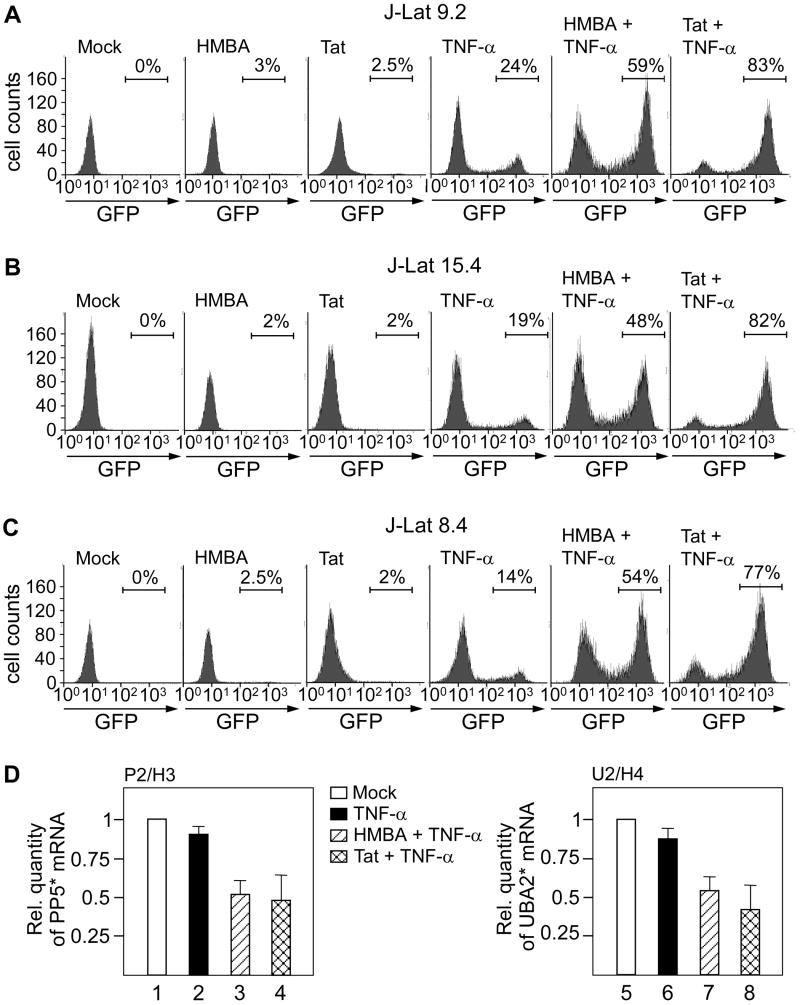
Figure 7. TNF-α together with HMBA or Tat act synergistically to activate transcription from the 5’LTR.
(A-C) Histograms obtained with FACS analysis of J-Lat 9.2, 15.4 and 8.4 cells as indicated on top of the panels. The numbers represent the percentage of GFP-positive cells indicated by horizontal lines. Cells were untreated (mock), treated with HMBA (HMBA), expressed Tat (Tat), treated with TNF-α alone (TNF-α) or in combination with HMBA (HMBA + TNF-α) as shown on top of each histogram. The last histograms on the right represent cells expressing Tat that were treated with TNF-α (Tat + TNF-α). (D) Relative quantity of PP5* (left panel) and UBA2* (right panel) mRNAs in untreated (mock, white bars), TNF-α-treated (black bars), HMBA + TNF-α treated (hatched bars) and cells expressing Tat that were treated with TNF-α (checkered bars) as determined using RT-qPCR. Primer pairs are denoted above the diagrams. Values in different samples were normalized to the GAPDH signal. The results for three RT-qPCR assays are shown ± SEM.

