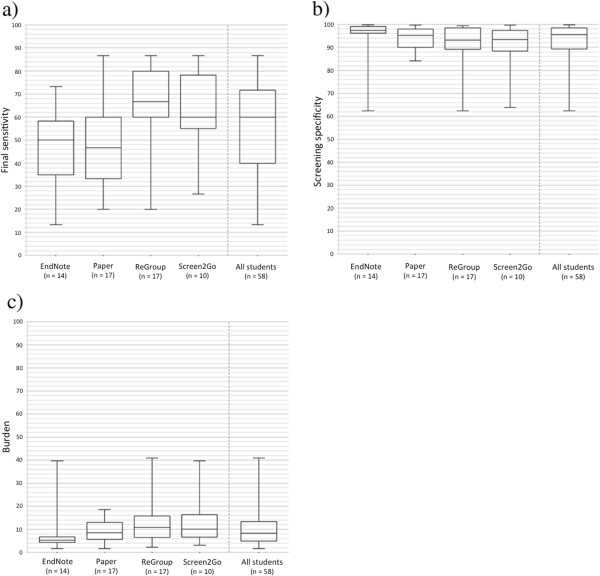
Figure 2.
Student screening performance by modality. Plots (a) and (b) show the distribution of final sensitivities (a) and screening specificities (b) observed in each screening modality as well as the overall pooled distribution, using those study reports ultimately retained in the review update after full-text review as the reference standard. Panel (c) shows the burden for each modality calculated using those study reports retained at screening by expert reviewers as the reference standard. Burden is a measure of workload that captures the proportion of all citations that need to be reviewed once screening is completed. Whiskers represent the minimum and maximum values and boxes delimit quartile ranges. The centre line in each box is the median value.

