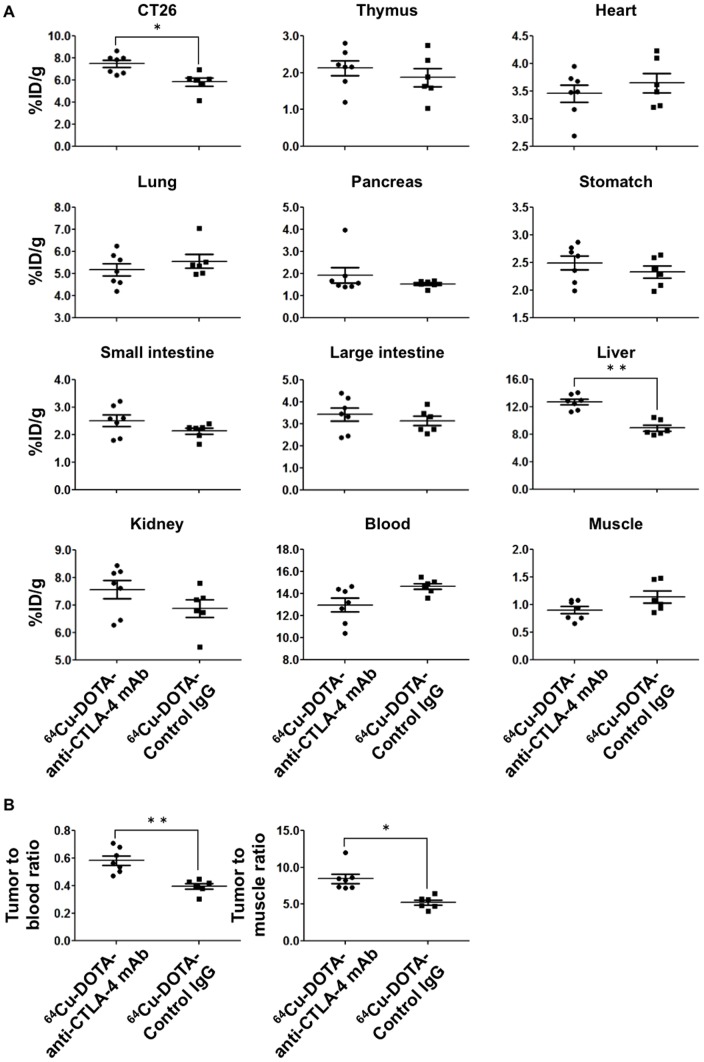
Figure 5. Biodistribution analysis of 64Cu-labeled antibody probes.
A. %ID/g of 64Cu-DOTA-anti-CTLA-4 mAb (n = 7) and 64Cu-DOTA-Control IgG (n = 6). B. Tumor-to-blood and tumor-to-muscle ratios of 64Cu-DOTA-anti-CTLA-4 mAb (n = 7) and 64Cu-DOTA-Control IgG (n = 6). Data are expressed as means ± SEM. Symbols* and ** denote p<0.01 and p<0.001 vs. 64Cu-DOTA-Control IgG, respectively.

