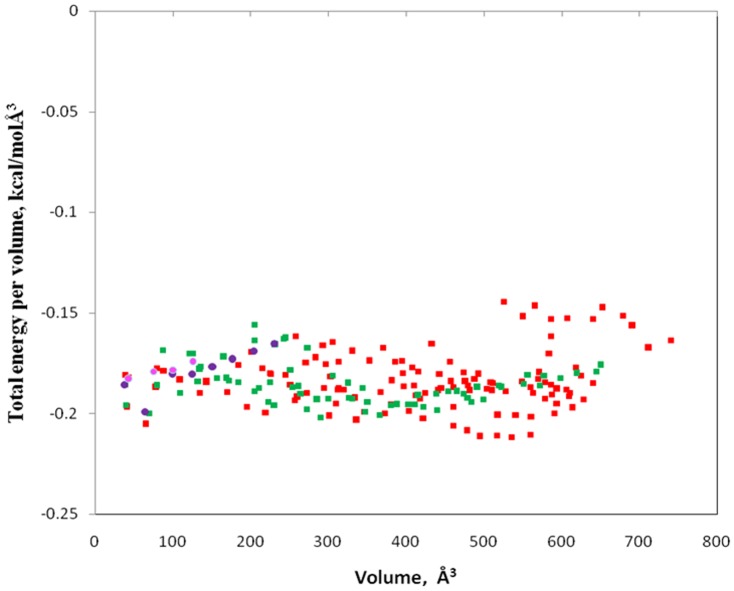
Figure 2. A plot of AutoLigand results of total energy per volume (kcal/molÅ3) versus volume (Å3), using fill sizes from 10 to 210 Å3.
The results include two novel binding sites plotted with red and green squares and a few sets of points plotted in blue and pink circles representing small cavities.

