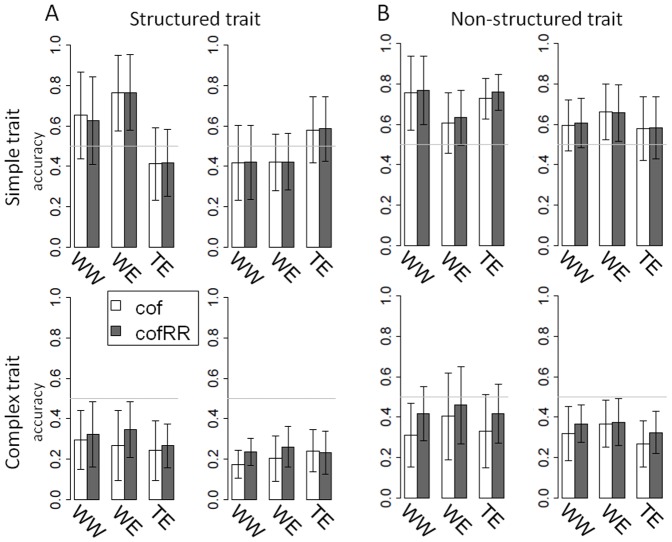
Figure 6. Mean accuracy of prediction in structured (A) and non-structured (B) trait.
We also compared here two combinations of training – candidate sets (i.e. the two figures on the left present within sub-population predictions and the two figures on the right present between sub-population predictions) and simple and complex traits through 10 replicates of the simulation. Training sets are indicated on the x axis, the two colors representing the methods used (cof, cofRR). Training and candidate sets comprised all individuals of the sub-population (1,000 and 200 individuals respectively), except for the model constructed on Call, which was tested on the entire breeding population (800 individuals).

