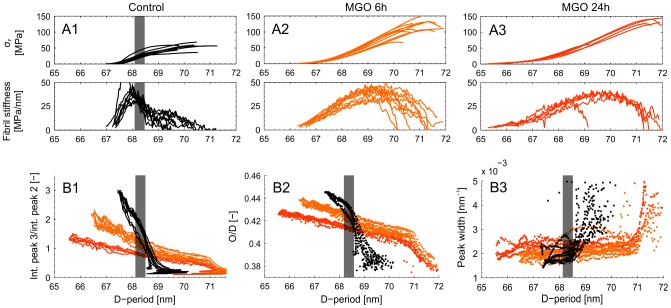
Figure 4. Results from SAXS experiments.
Row A) Collagen fibril stress) vs. D-period. Normalized collagen fibril stress was calculated using the rule of mixtures. The numerical gradient (slope) of the D-period vs. collagen fibril stress curves was used to measure fibril stiffness. Peak stiffness was used as the parameter for statistical interference testing. The second experimental set (w/o a 24 h MGO group) is not plotted here since over all the stresses were approximately one third lower but with equal group effects (two-way ANOVA: interactions term, p = 0.531). B1) Ratio of the integrated intensities for the 2nd and 3rd order meridional collagen reflections. B2) Relative contribution of overlap (O) region to the D-period (O/D) vs. D-period, when assuming a two-phasic approximation of the D-period electron density [17], [63]. B3) Peak widths (FWHM) from fitted Gaussians measured during the tensile experiments vs. D-period length. Note: The grayed area in the insets represents the range of yield point of the control samples as reference.

