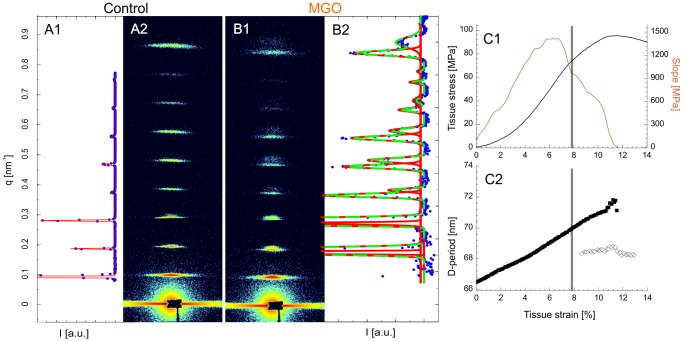
Figure 5. Failure mode of collagen fibrils.
A+B) Diffraction patterns recorded after yielding. A) A control sample. B) A 6 h MGO sample. The corresponding 1D azimuthal averages are indicated by blue dots. The intensity range is scaled to show the full scale from the 3rd diffraction peak. Peaks were fitted to Gaussian functions (red). In some MGO samples the best fit was bimodal Gaussian (green) in account of the peak splitting as the sum of two Gaussians (red). The first peak is not shown. C) Stress-strain curve of a MGO sample that showed peak splitting shortly after yielding (grey horizontal bar). The gradient of the stress-strain curve, which is a local estimate of elastic modulus, is also shown. D-period estimates of the same sample is also shown (3rd reflection), with the loaded and deformed collagen fibrils (♦) and the more relaxed ones (◊).

