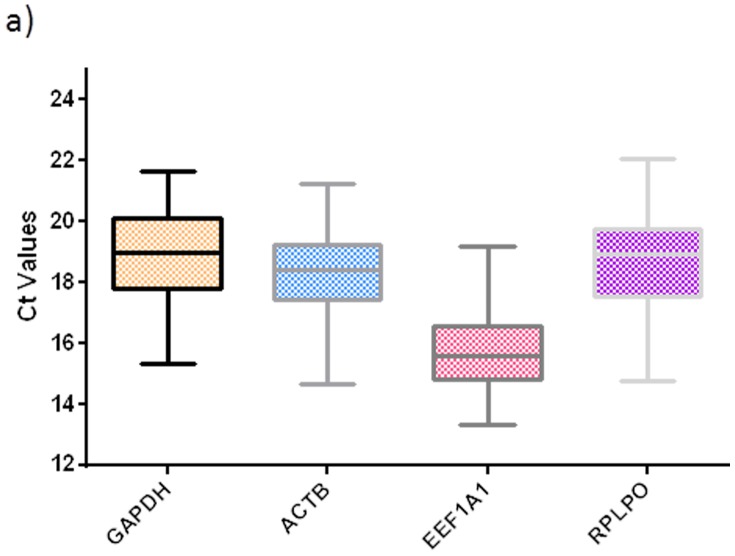
Figure 1. Ct values of the candidate mRNA reference genes in cervical tissues.
Boxplots shows interquartile range box, median and range whiskers, from the raw Ct values obtained from the amplification curves. All the genes showed a normal distribution pattern across all the cervical tissue conditions as confirmed by the D′Agostino–Pearson normality test.

