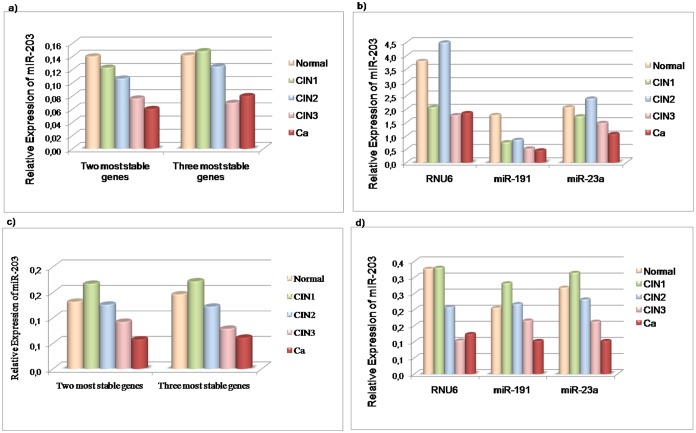
Figure 5. Effects of normalizers on the expression profile of miR-203 across cervical tissues.
In this diagram: the normal tissue is represented by the blue bar; CIN1 is represented by the red bar; CIN2 is represented by the green bar; CIN3 is represented by the pink bar; and cancer (Ca) is represented by the purple bar. Graphs a) and c) show miR-203 expression profile using NFs obtained from individual Ct analyses, as well as NFs from pooled Ct analyses, respectively. Graphs b) and d) shows miR-203 expression normalized to individual Ct values and the pooled Ct values of each single candidate reference gene.

