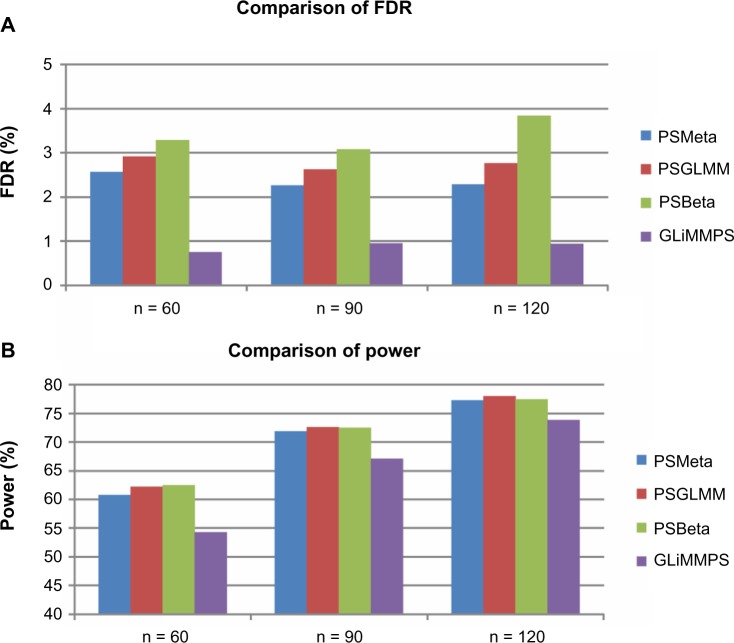
Figure 2.
Comparison of false discovery rate and power using all simulated exon-trios. (A) The FDR was calculated as the fraction of false discoveries (ie, an SNP with FDR-adjusted P value < 0.05 but was not designated as an sQTL SNP in the simulation) among all discoveries (ie, an SNP with FDR-adjusted P value < 0.05). (B) Power was calculated as the fraction of SNPs with FDR-adjusted P values < 0.05 among all designated sQTL SNPs.

