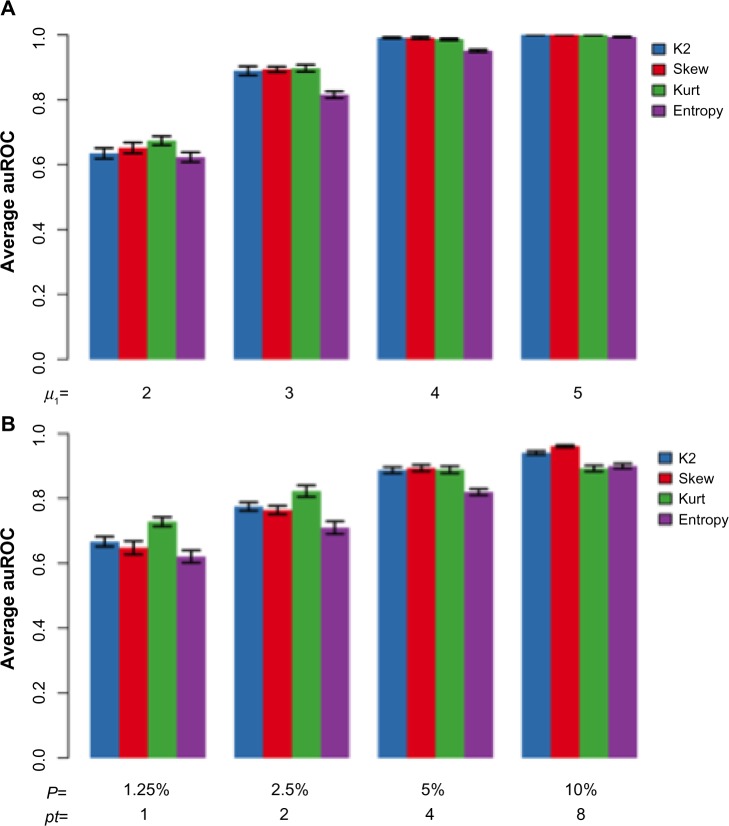
Figure 2.
Comparison of AUCs from different simulations. Simulations were carried out with the same set of parameters as in Figure 1 (n0 = n1 = 5000, μ0 = 0, , μ1 = 3, , pt = 4), except for that in panel (A) different μ1 and in panel (B) different pt were used. Values for μ1 and pt are shown on the x-axis of each panel. The AUC values are averaged over 10 simulations.

