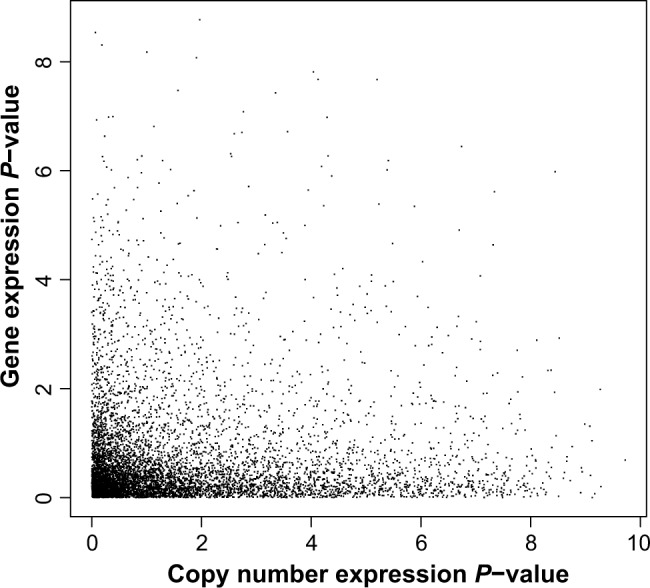
Figure 7.

A plot of the P-values from the K2 test for copy number expression (horizontal axis) and from the K2 test for transcript mRNA expression (vertical axis). There are 7534 genes on the plot, and statistics were computed using 18 samples. The axes have been transformed using −log10(P-value).
