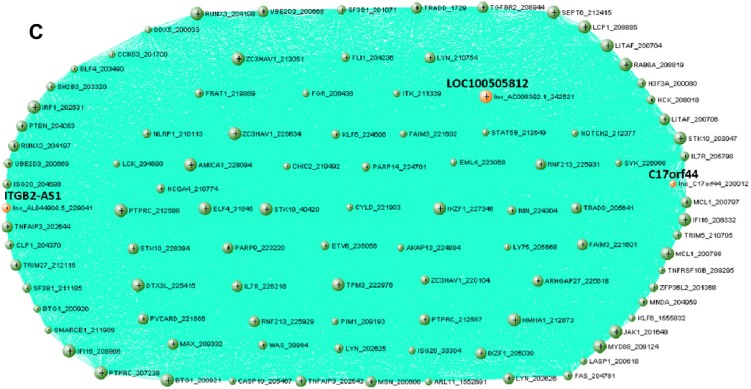
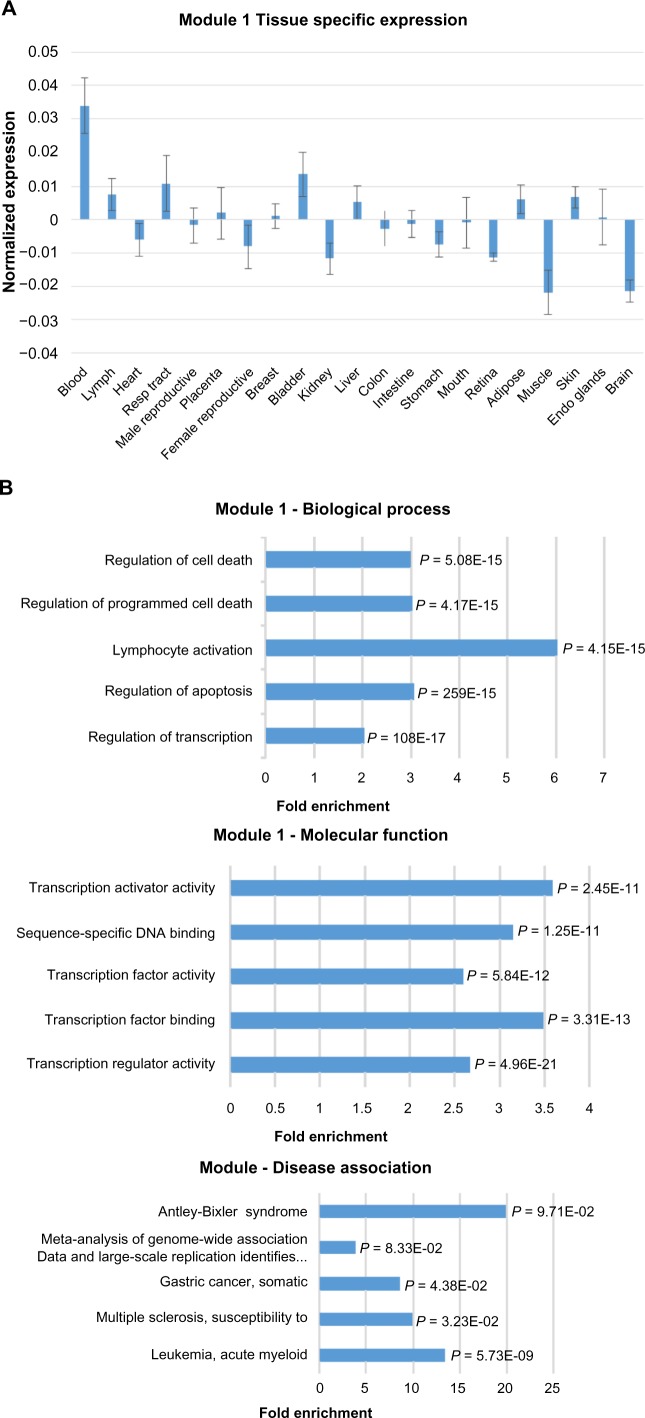
Figure 2.

Expression, functional term enrichment, and network visualization of the largest Module 1 with high level of expression in blood. (A) Chart of the average expression levels of Module 1 genes in broad tissue types. Error bars represent standard deviations. (B) DAVID functional analysis of Module 1 genes. The enriched terms for biological process, molecular function, and OMIM disease association are plotted against fold enrichment with the corresponding P-value. (C) VisANT network visualization of the top 100 probes with the highest intramodal connectivity within Module 1. Node size is proportional to intramodal connectivity and edges are based upon TOM values with the minimum threshold set to 0.06.

