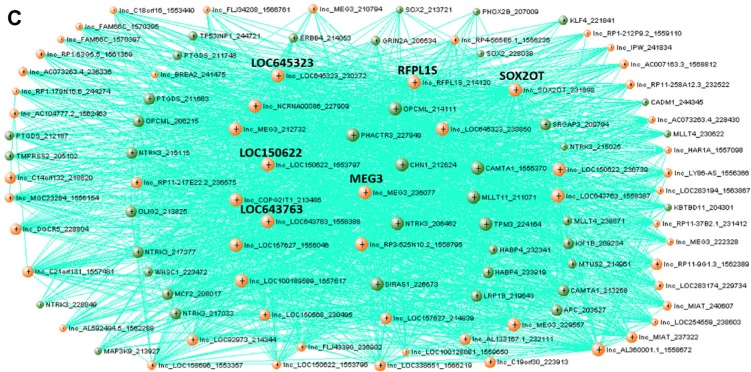
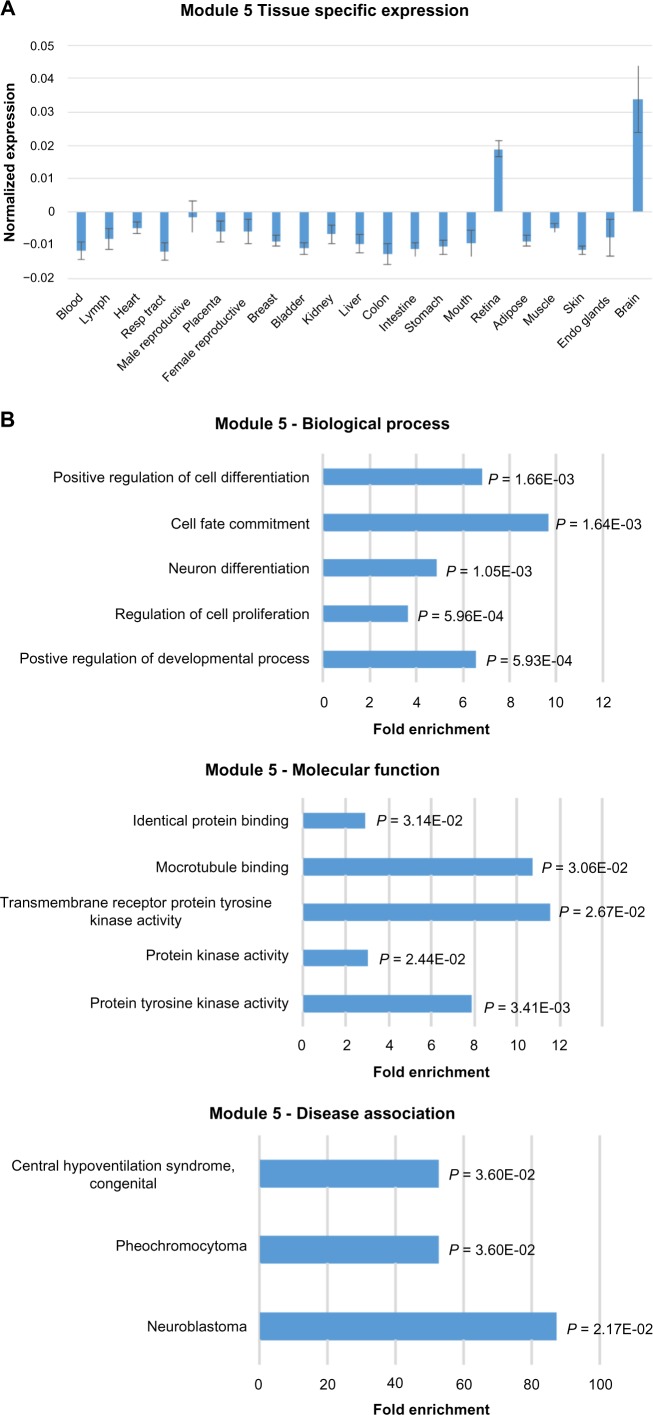
Figure 4.

Expression, functional term enrichment, and network visualization of Module 5 genes with high proportion of lncRNAs and high level of expression in brain tissues. (A) Average expression levels of Module 5 genes in broad tissue types with standard deviation bars. (B) Functional enrichment analysis of Module 5 genes. The enriched terms for biological process, molecular function, and OMIM disease association are plotted against fold enrichment with the corresponding P-value. (C) VisANT network visualization of the top 100 probes with the highest intramodal connectivity within Module 5. The minimum TOM value threshold for edges is set to 0.06.

