
Figure 1.
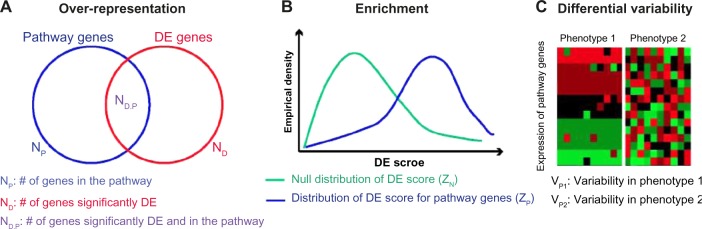
Pathway analysis methodologies from gene expression: (A) Over-representation analysis first performs a statistical test for each gene by comparing expression values in phenotypes to identify a set of significantly DE genes, obtaining a gene count ND. The procedure then counts the number of DE genes that are also annotated to a specified pathway (ND,P) and calculates a P-value for enrichment of that pathway by testing if ND,P is unusually high relative to ND and NP (the number of genes in the pathway). (B) Enrichment analysis first assigns an individual DE score to each of the genes annotated to a pathway, and aggregates these into a pathway score ZP. A similar score is computed for a null distribution, ZN. For example, this null distribution may be defined empirically from the DE score for alternative sets of genes or permuted sample labels. Enrichment analysis forms a pathway statistic by comparing the distribution of DE scores in ZP to that of DE scores in ZN. (C) Differential variability analysis defines a statistic to measure variability of the expression of pathway genes for samples from a given phenotype, denoted by VP1 and VP2 for phenotypes 1 and 2, respectively. If the variability between two phenotypes is significantly high (ie, |VP1 − VP2| >> 0), the pathway is identified as dysregulated.