
Figure 2.
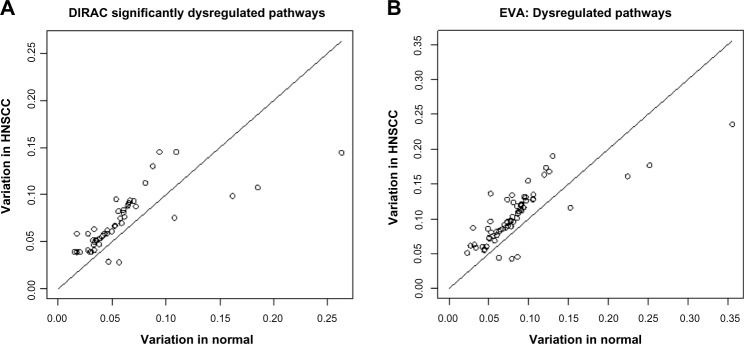
Comparison of dysregulated pathways identified by (A) DIRAC and (B) EVA in comparing head and neck squamous cell carcinoma samples (y-axis) and normal samples (x-axis). Hence, the pathways shown above the line are those with significantly (P-value <0.05) higher variability in tumor than normal samples, and those below the line have significantly higher variability in normal samples.