
Figure 3.
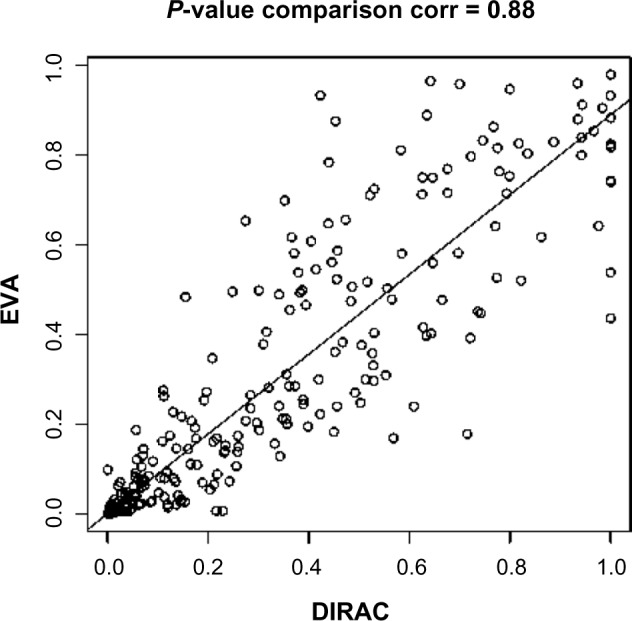
P-value comparison of DIRAC and EVA: Each circle represents a pathway. x-axis and y-axis represent DIRAC and EVA P-values, respectively.
Official websites use .gov
A
.gov website belongs to an official
government organization in the United States.
Secure .gov websites use HTTPS
A lock (
) or https:// means you've safely
connected to the .gov website. Share sensitive
information only on official, secure websites.
P-value comparison of DIRAC and EVA: Each circle represents a pathway. x-axis and y-axis represent DIRAC and EVA P-values, respectively.