
Figure 4.
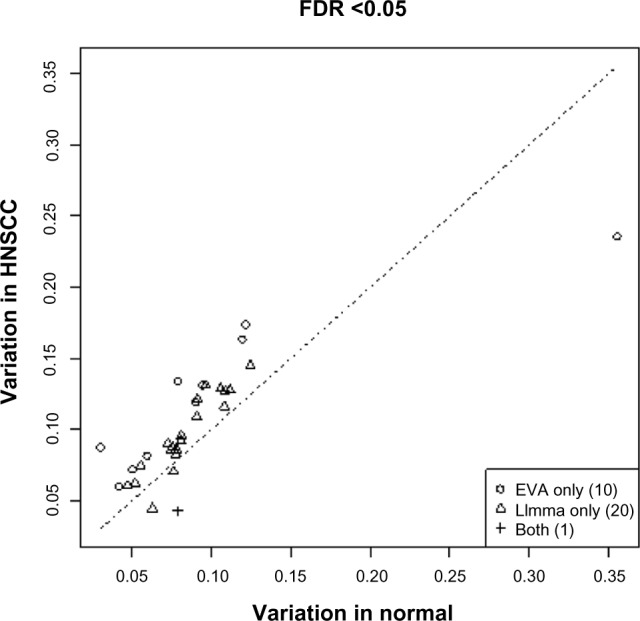
Comparison of dysregulated pathways identified by EVA and LIMMA analysis. Each point represents a pathway, and we compare samples from head and neck squamous cells (y-axis) and normal samples (x-axis). The pathways are detected by at least one of the algorithms significant. This figure shows that LIMMA and EVA may produce different analyses.