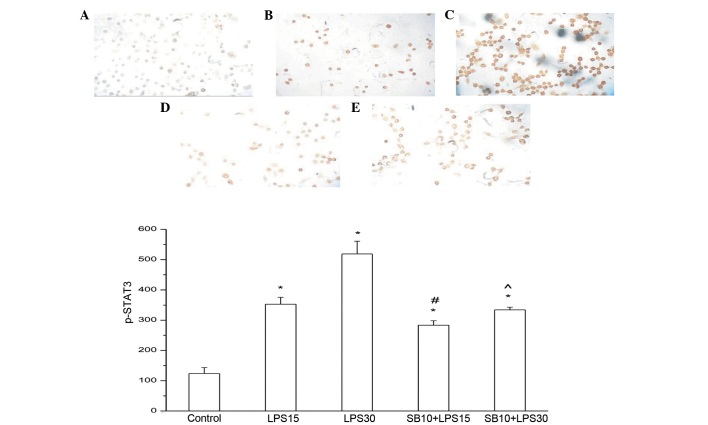
Figure 4.
Immunocytochemical analysis of phosphorylated-signal transducer and activator of transcription-3 (p-STAT3) in the MH-S cells in the (A) control, (B) lipopolysaccharide (LPS) for 15 min, (C) LPS for 30 min (D) SB2035880 for 10 min + LPS for 15 min and (E) SB2035880 for 10 min + LPS for 30 min (diaminobenzidine stain; magnification, ×200). p-STAT3 expression increased significantly following LPS stimulation. Following the addition of SB203580, p-STAT3 expression decreased significantly. *P<0.05, vs. control; #P<0.05, vs. LPS at 15 min. ^P<0.05 vs. LPS30 min.

