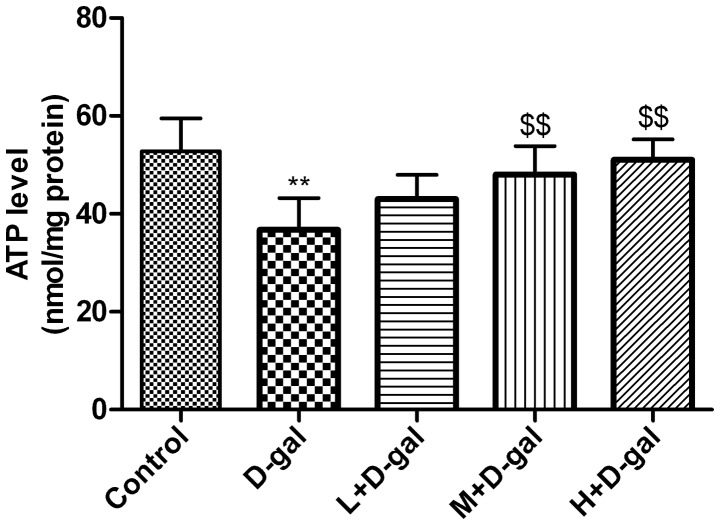
Figure 3.
Effect of Lactobacillus plantarum NDC 75017 on the D-gal-induced the changes in ATP content. Data are presented as the mean ± standard deviation (n=10). **P<0.01 vs. the control group; $$P<0.01 vs. the D-gal group. L, low-dose L. plantarum NDC 75017; M, medium-dose L. plantarum NDC 75017; H, high-dose L. plantarum NDC 75017; D-gal, D-galactose; ATP, adenosine triphosphate.

